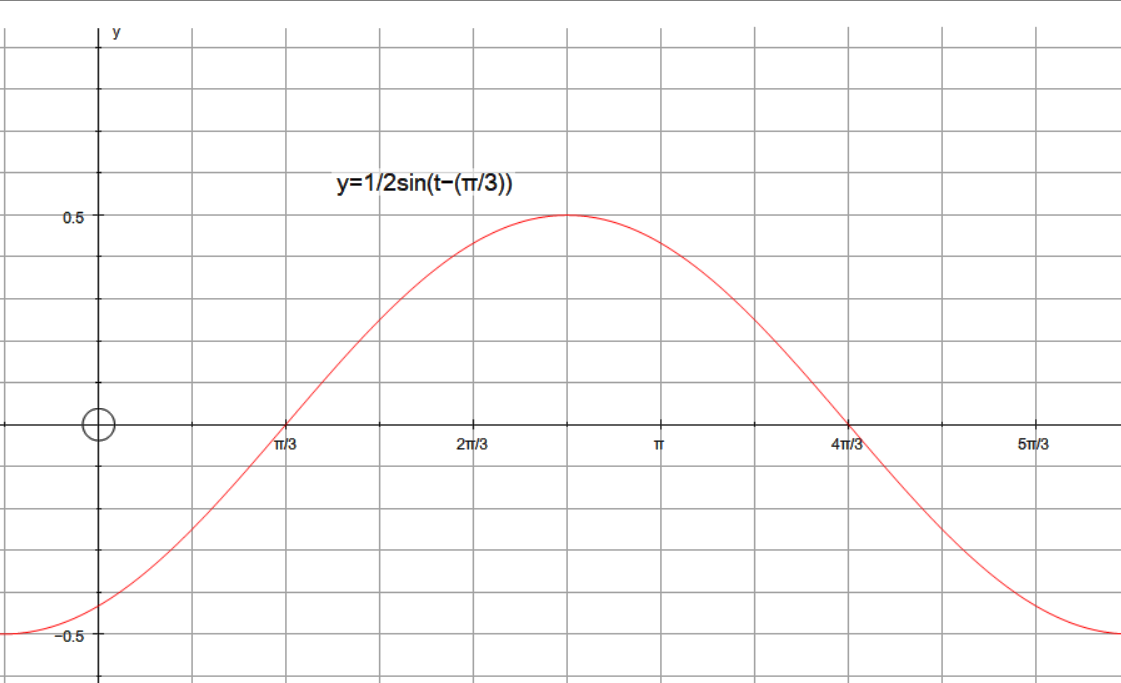
If we express a sine function in the following form:
#y=asin(bx+c)+d#
We have:
#bbacolor(white)(888.88)# is the amplitude.
#bb((2pi)/b)color(white)(8.88)# is the period
#bb((-c)/b)color(white)(.8.8)# is the phase shift.
#color(white)(8)bbdcolor(white)(88.8.8)# is the vertical shift.
So:
Amplitude will be the highest or lowest point on the graph. This can be seen to be #1/2#. The amplitude is given as an absolute value, so:
#|-1/2|=1/2#
If we look at:
#y=sinx#, we note that at #x=0# , #sinx=0#
From the graph we can see that the graph of #y=sinx# has been shifted to the right by #pi/3# units, This is the phase shift. From the above we have:
Phase shift is:
#(-c/b)#
#b=1#
#c=epsilon#
So:
#(-epsilon)/1=pi/3#
#epsilon=-pi/3#
The graph confirms this.


