How to sketch this sin graph?

1 Answer

See below.
Explanation:
We can express this function in the form:
Where:
#color(white)(888)bba# is the amplitude.-
#color(white)(88)bb((2pi)/b)# is the period. ( this is the normal period divided by#bb(b))# -
#color(white)(88)bb((-c)/b)# is the phase shift. -
#color(white)(888)bbd# is the vertical shift.
Multiply the bracket by the
We can see from this, that:
Amplitude is
Period is
Phase shift is
Vertical shift is
If we look at this in relation to
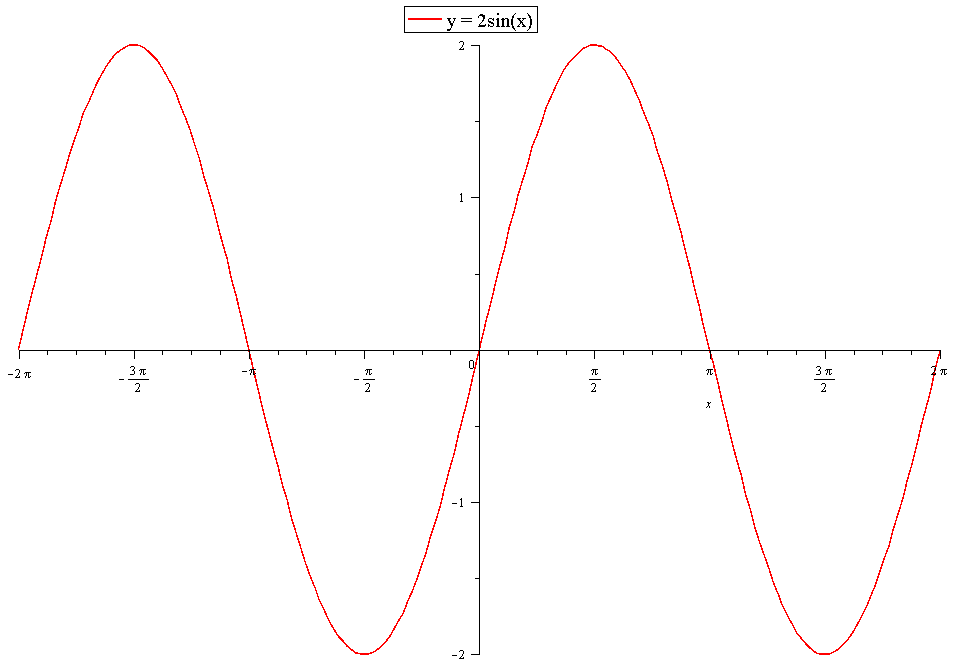
The amplitude has been increased by a factor of
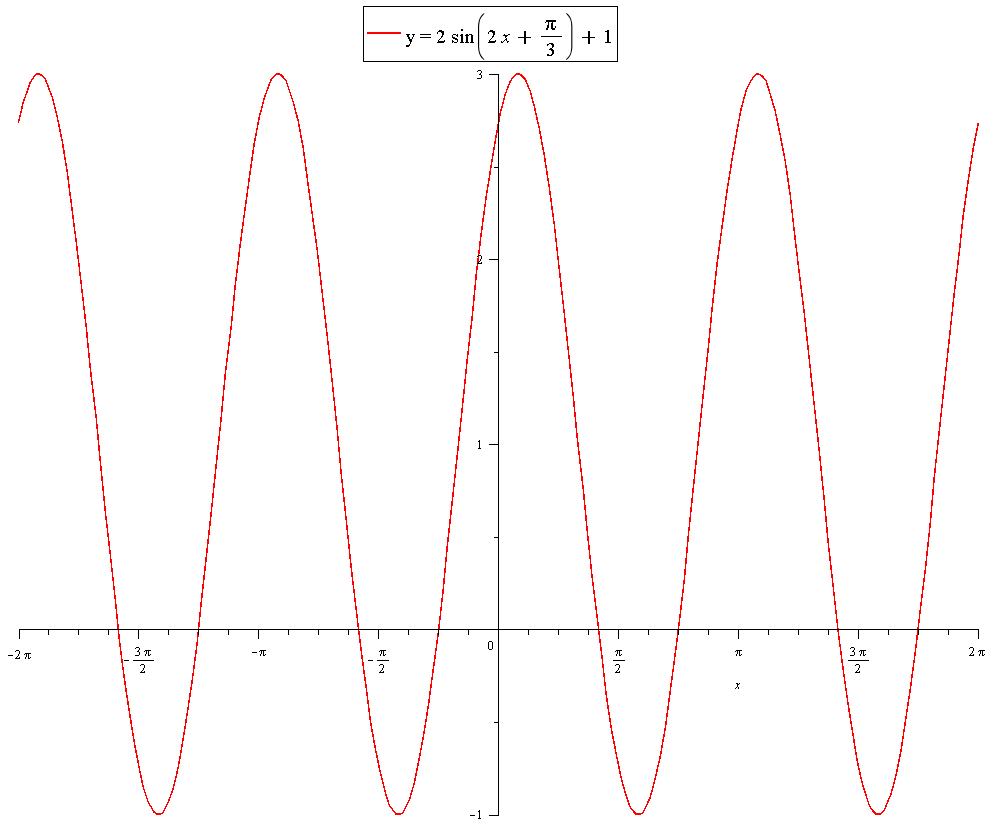
I'll plot all the different changes in relation to
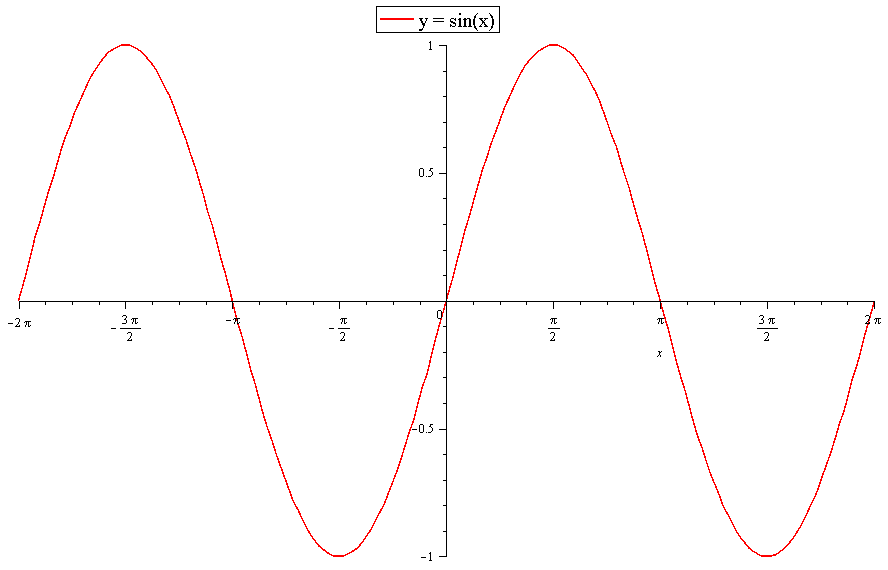
This is shown in the graph
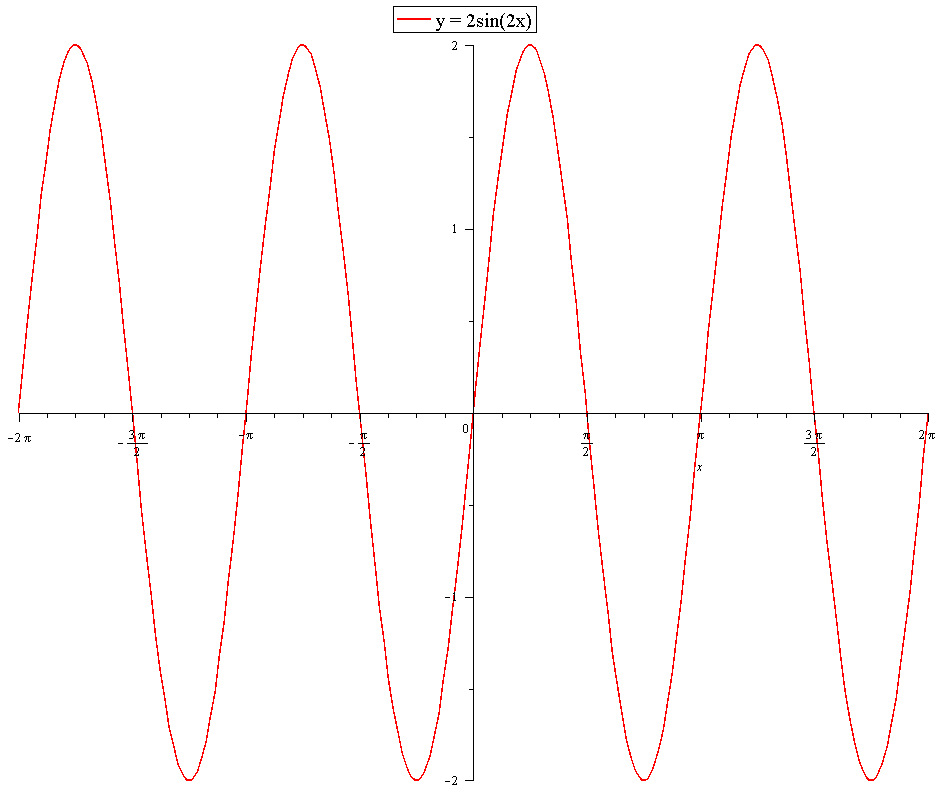
The period has been compressed by a factor of
The phase shift is
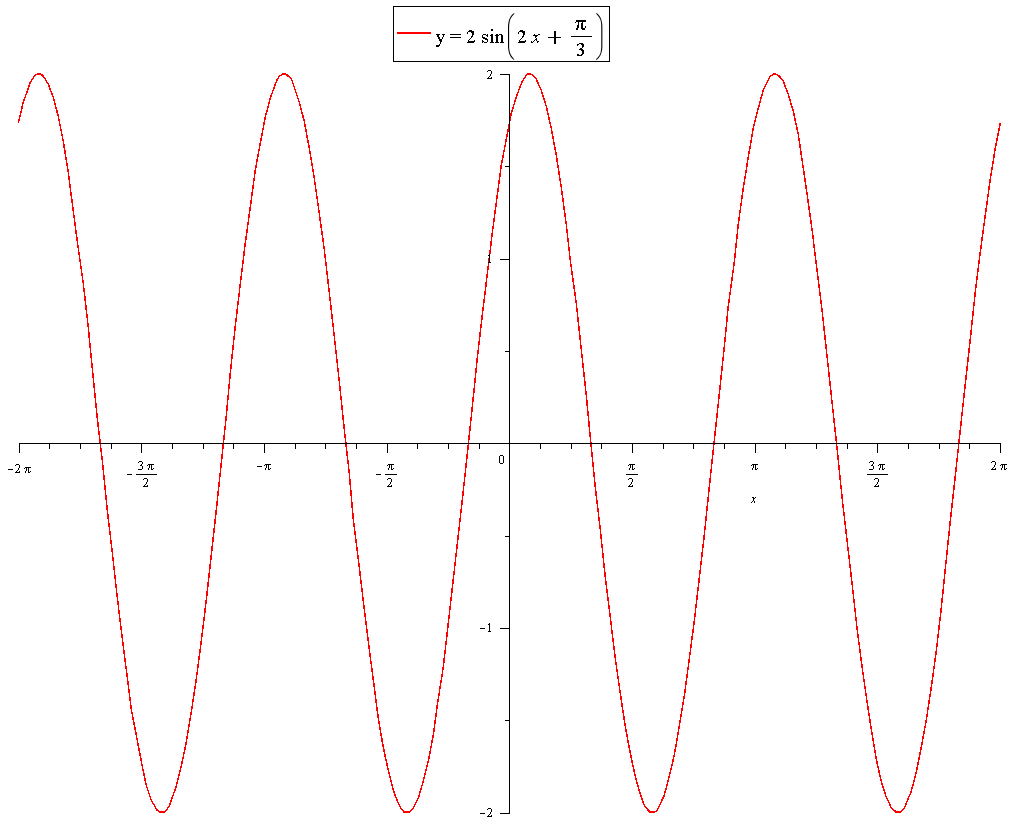
The vertical shift is
This is now complete.
Here is a link that explains all the different parts of trig function graphs. It would be worth taking a look. It includes lots of graphics so you can see exactly what's happening.
https://www.mathsisfun.com/algebra/amplitude-period-frequency-phase-shift.html.
