I just learnt the whisker-plot (box-plot) and will go with the option #C# and #D#. I just want you to make me correct if I am wrong or provide the explanation if my choices are right?
1 Answer

Explanation:
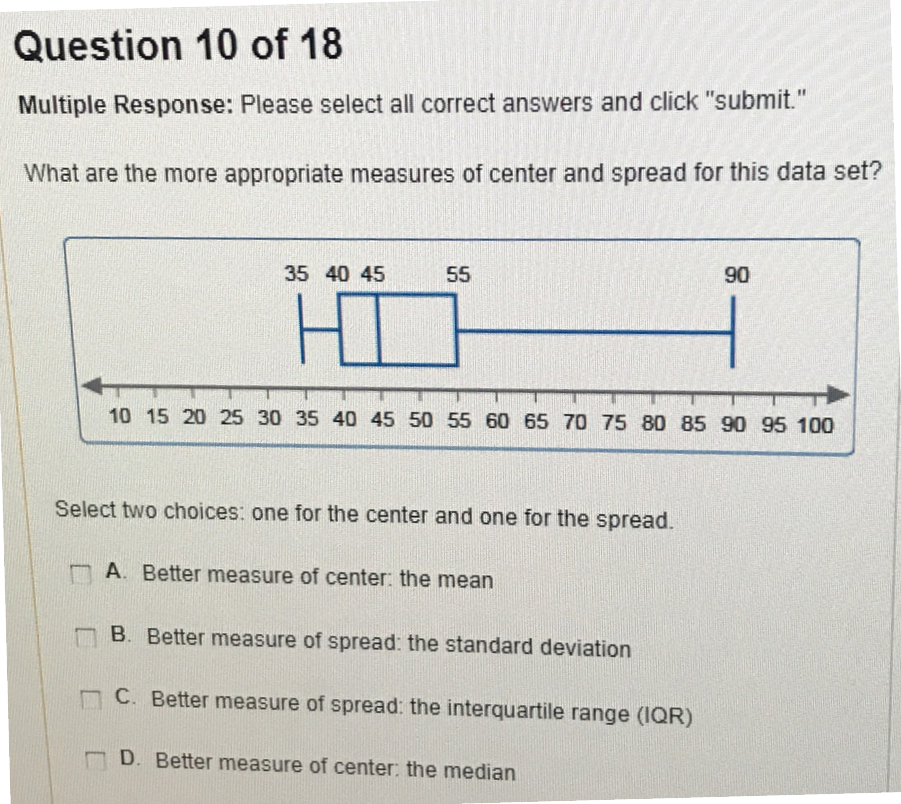
#"the "IQR=55-40=15#
#"and is a measure of the spread of the middle "50%#
#"of the data set"#
#"median "=45#
#"other methods are available for calculating the mean"#
#"and standard deviation"#
The median and IQR are better than the mean and standard deviation (respectively) because both the mean and s.d. will be heavily influenced by the upper quartile of data.
The top 25% of data are spread out in a range wider than the lower 75%. A graph of this data would likely be skewed to the right (have a stretched right tail). Thus, the mean would be further from the majority of data points than the median would be, and the standard deviation would also be quite large because of how many data points are above the median.
The median and IQR tell a better story of where the data is centred and how it is spread.
