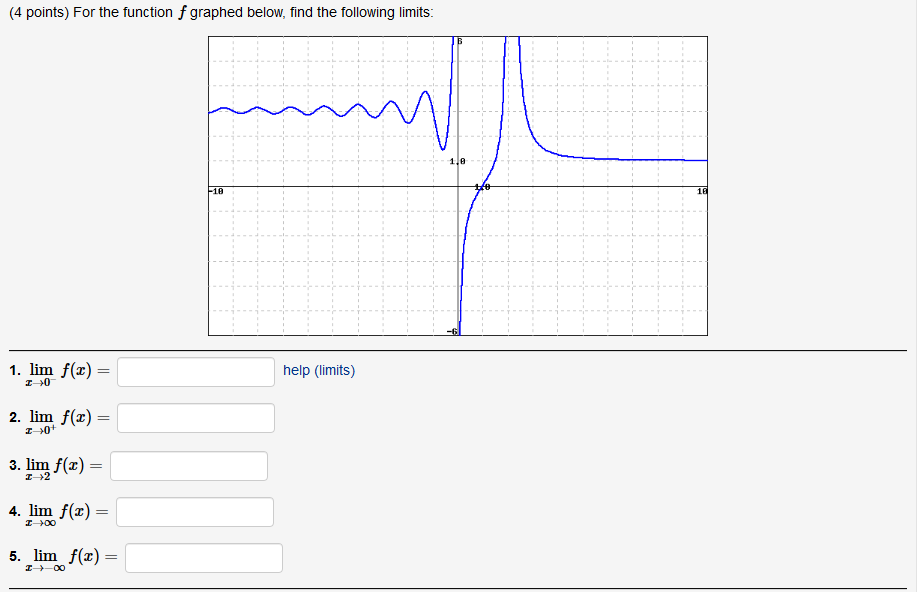
#x->0^-#
the #-# sign means 'approaching from the left', or from lower #x-# values.
here, the limit as #x# tends to #0# from negative #x-#values is #oo#.
#x->0^+#
the #+# sign means 'approaching from the right', or from higher #x-# values.
here, the limit as #x# tends to #0# from positive #x-#values is #-oo#.
#x->2#
this is the limit as #x# tends to #2#.
here, the limit is the same whether #x# is approaching #2# from higher values #x->2^+# or lower values #x->2^-#. it is #oo#.
#x-> oo#
this is the limit as #x# tends to infinity, at the furthest right of the graph.
it seems that the graph has a horizontal asymptote, at #y=1#.
this means that, to the right of #x=2#, #y# does not reach #1#. it only tends to it, meaning #1# would be the limit.
#x -> -oo#
this is the limit as #x# tends to negative infinity, at the furthest left of the graph.
on the left of the graph, it can be seen that the #y-#value fluctuates and then becomes closer to a certain line.
that line is #y=3#, and that is the limit of the #y-#value as #x# approaches negative infinity.
the limit as #x# tends to #-oo# is #3#.