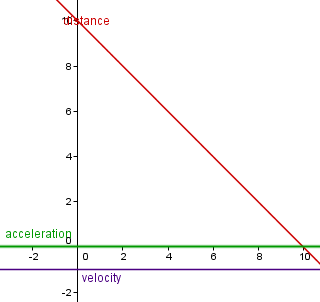
If a distance-time graph (starting at (0,10) and ending at (10,0) has a negative linear trend, then what would the velocity-time and acceleration-time graphs look like?

1 Answer
Oct 24, 2015

The graphs for the functions, #x=-t+10#, #v=-1#, and #a=0#.

Explanation:

This is a derivatives problem, where #v=(dx)/(dt)# and #a=(d^2x)/(dt^2)#. Since we are given that #x(t)# is negative linear, we can infer that the velocity function, #v(t)# will be a negative constant, and therefore the object is not accelerating, so #a(t)=0#.

If we want to graph these curves, we need to start by finding #x(t)#, which we can identify by finding the slope and #y#-intercept and plugging them into the slope intercept form of a linear function, #x(t)=mt+b#. To find the slope, use the slope formula;

#m=(y_2-y_1)/(x_2-x_1) = (0-10)/(10-0) = -1#

We are conveniently given the #y#-intercept, #(0,10)#, so;

#x(t)=-t+10#

Velocity can be found by taking the derivative, which in the case of a linear function is just the slope, #m#.

#v(t)=-1#

Find the velocity derivative to get acceleration.

#a(t)=0#

So our graphs look like;

enter image source here