If a velocity-time graph (starting at (0,0) and ending at (10,10) has a positive linear trend, then what would the distance-time and acceleration-time graphs look like?
1 Answer

Sep 2, 2015
They would look like this:
Explanation:
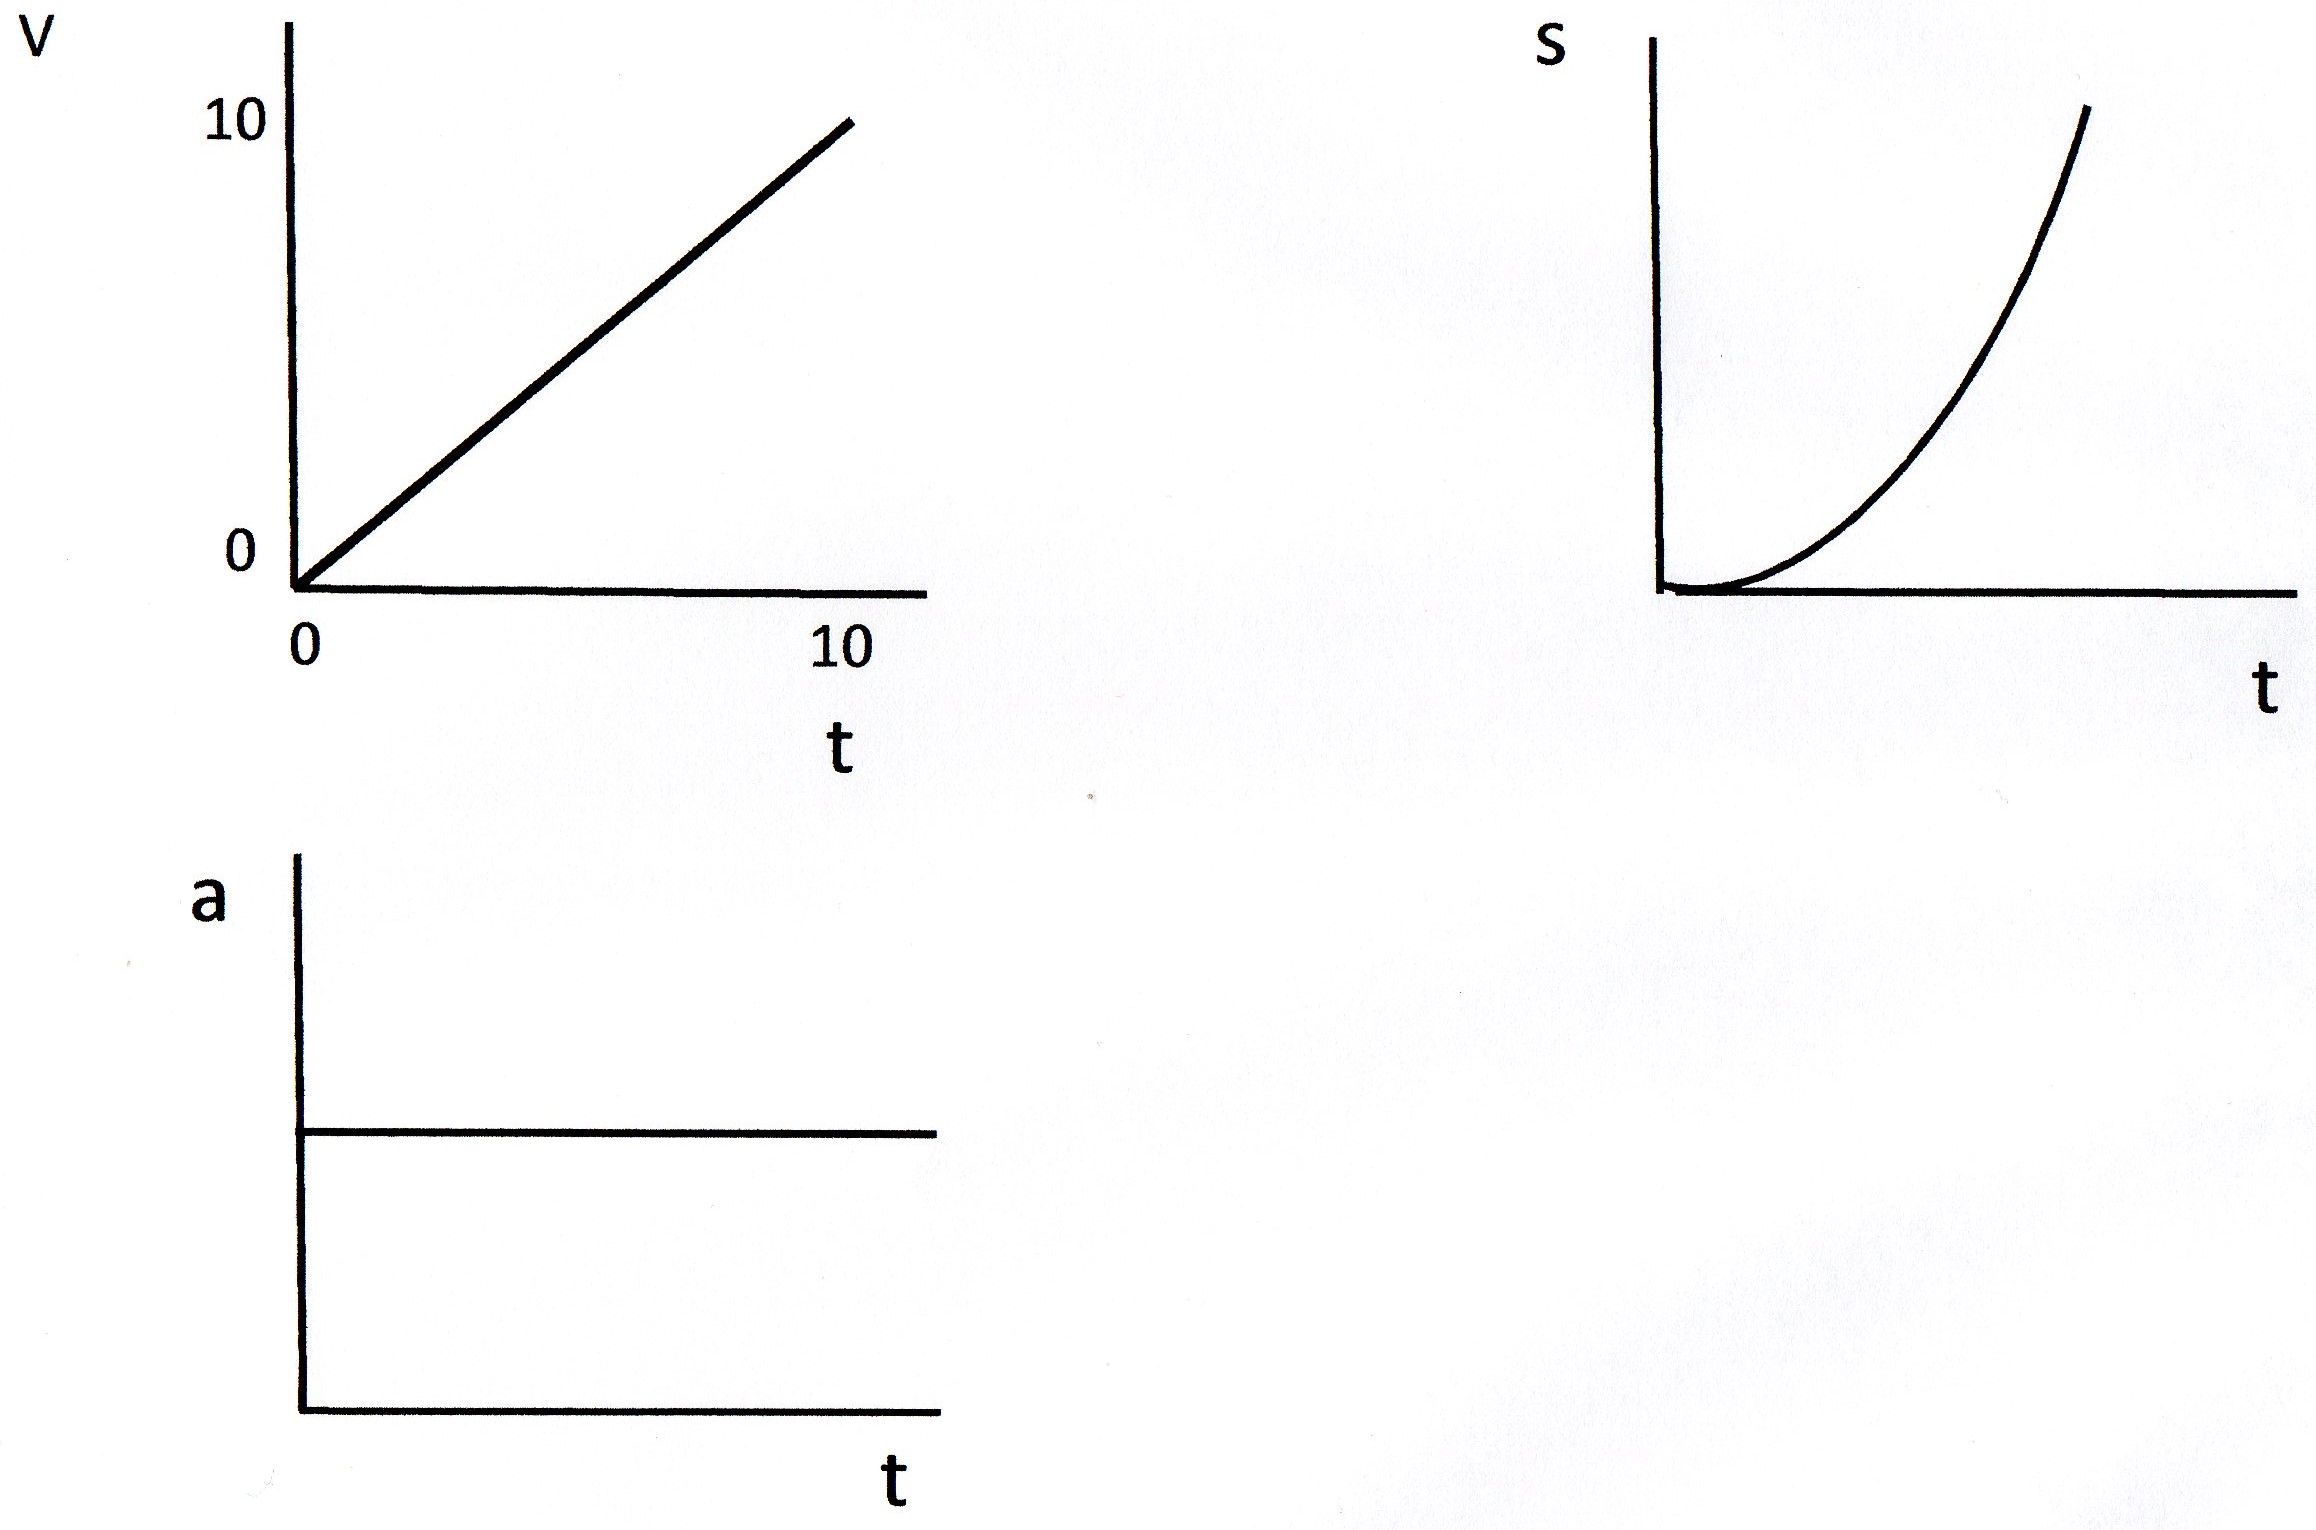
For the 1st graph you can see that
This gives a straight line of gradient 1 meaning constant acceleration.
This gives the 3rd graph of acceleration / time to be a horizontal line of gradient zero.
The 2nd graph of distance / time is of the form :
This gives you the parabola.
