In the modern atomic model, the electron cloud is denser in some locations than in others. What do the denser areas represent?
1 Answer

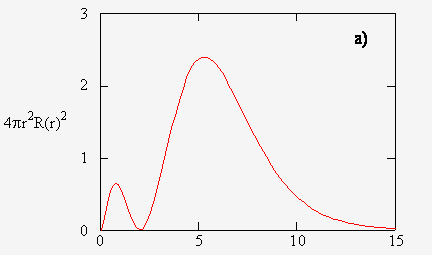
For context, we are looking at the radial density distribution of a chosen atomic orbital. Let's say we are looking at the
It tells you that if you start with a viewing window of a dot, when you expand the radius of that dot, you get a circular viewing window of radius
Note that we only see what is on the circumference of our viewing window, not what is inside. That is, as
As we expand our viewing window, we run into regions of the electron cloud that are denser than others (a taller
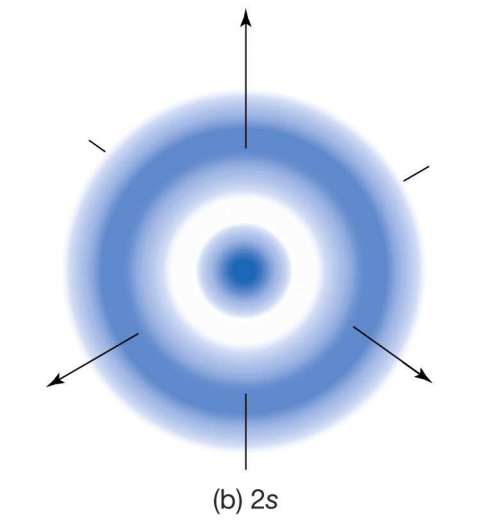
If you stare at the screen long enough, you should see the correlation between the
Since the radial probability density is a distribution of encountered electrons over time, it means that the denser regions contain a greater probability of encountering an electron.
In other words, you will have an easier time finding an electron in a region of greater electron density.
