Let f=(x/2)+3 be defined on the closed interval {-2,4}, estimate the area under the graph of f above the x-axis using: a. 6 left endpoint rectangles b) 6 right endpoint rectangles?
1 Answer

Left endpoint rectangles:
Right endpoint rectangles:
Explanation:
Estimating the area under a graph is a preview of integration. In integration, we're interested in finding the exact area under a graph between two endpoints.
Here is the exact area we are trying to estimate:
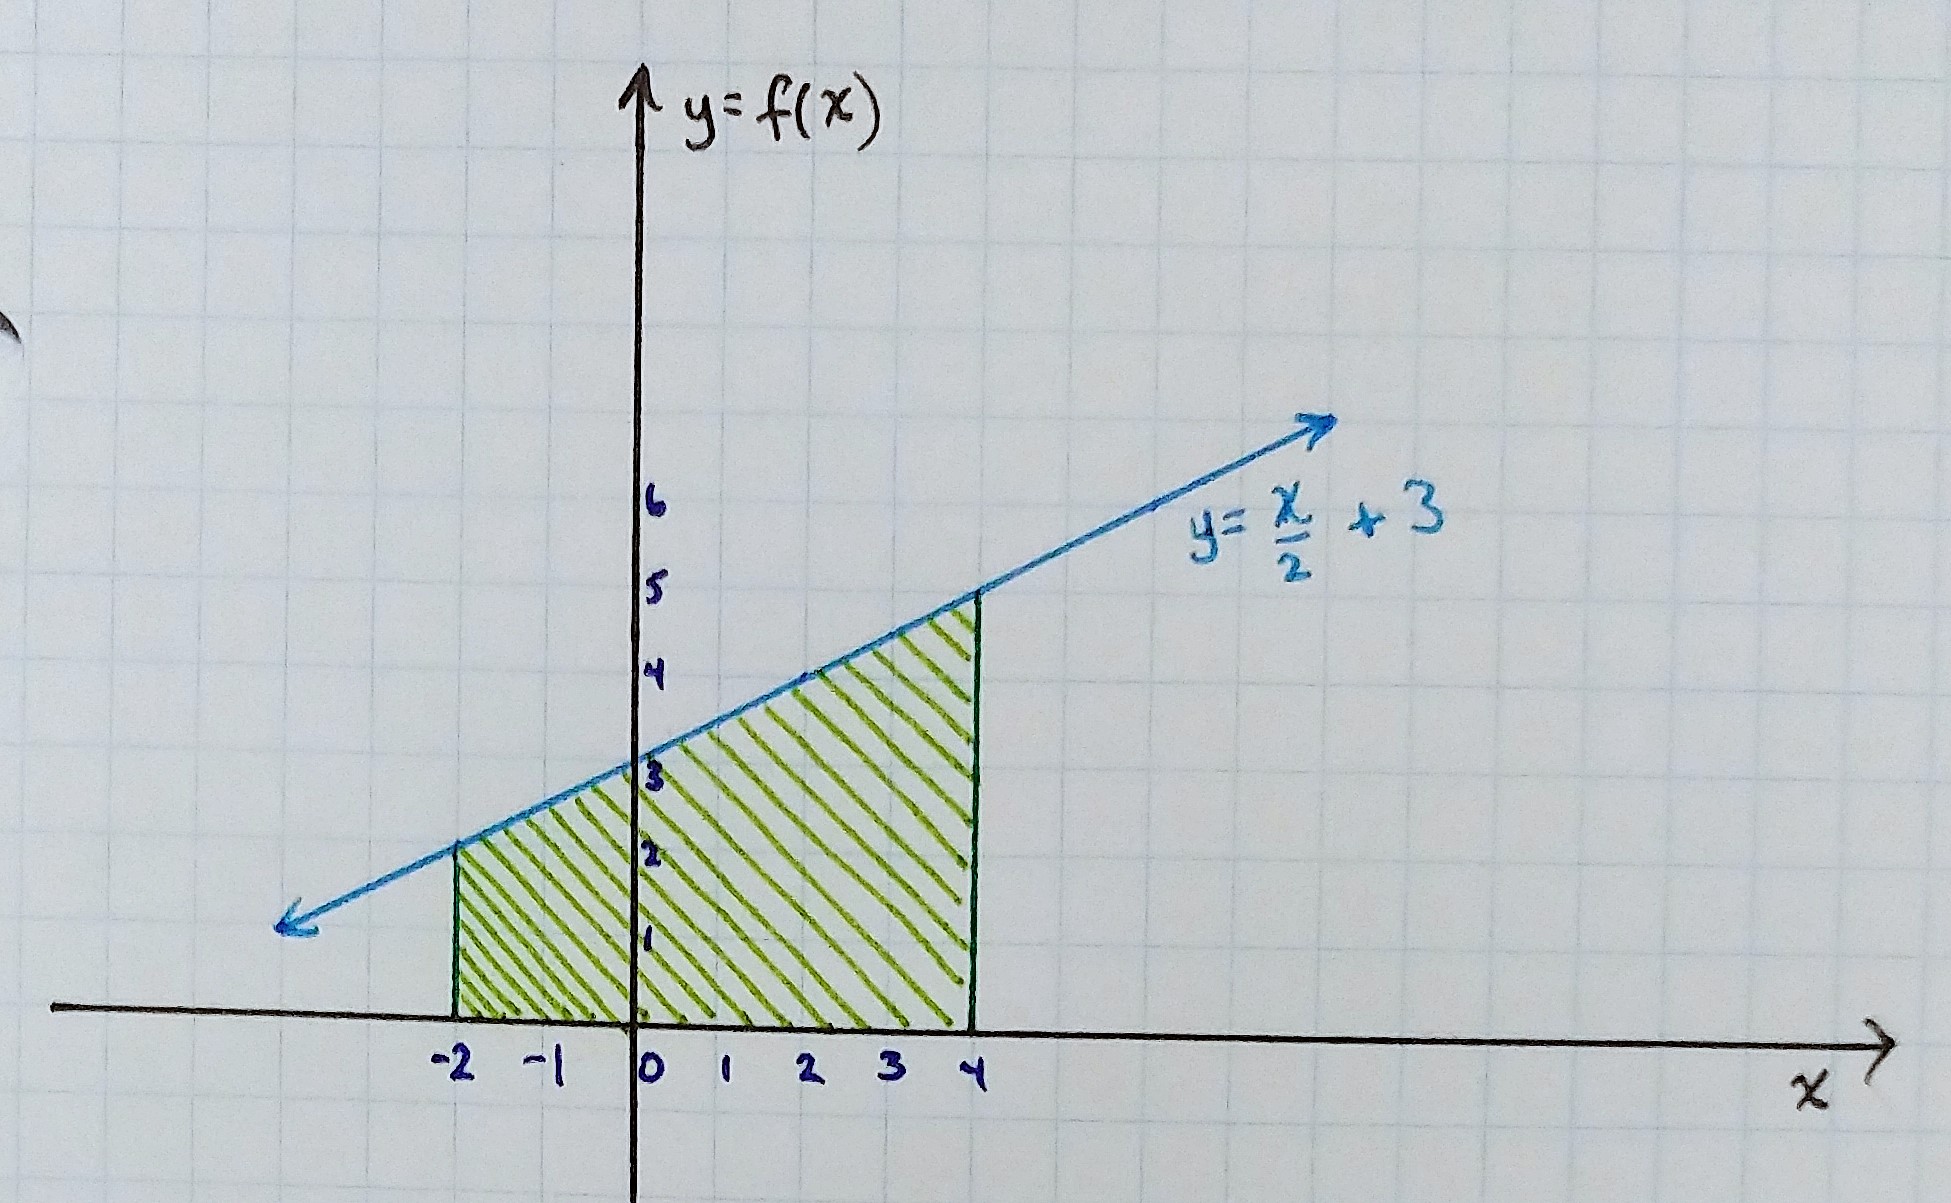
The interval
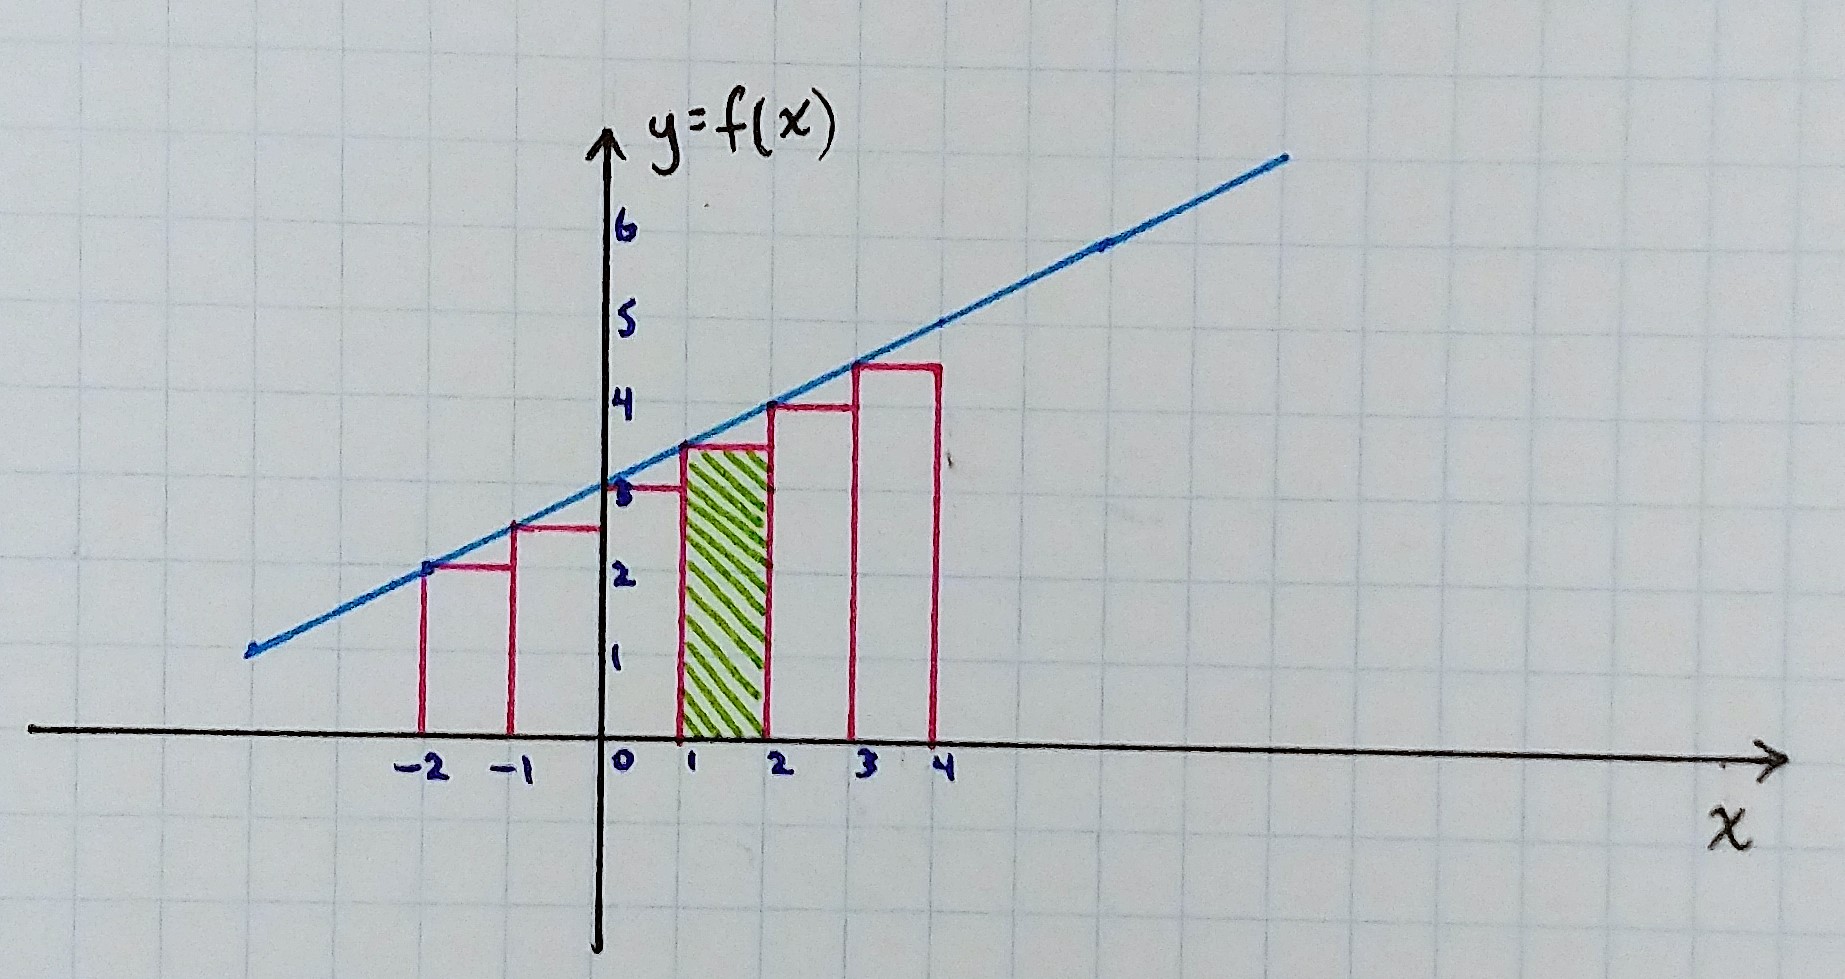
a) Left endpoint rectangles
One way is to choose the heights to be the function value for the left endpoint. For example, between
In general, for each interval
Using this method, our estimate of the function area is
#sum_(x=–2)^3color(gray)(stackrel"rectangle width"overbracecolor(black)[[(x+1) - x]])*color(gray)(stackrel"height"overbrace color(black)f(x))#
# = sum_(x=–2)^3f(x)#
# = f(–2)+f(–1) + f(0) + f(1) + f(2) + f(3)#
#=2 + 2.5 + 3 + 3.5 + 4 + 4.5#
#= 19.5#
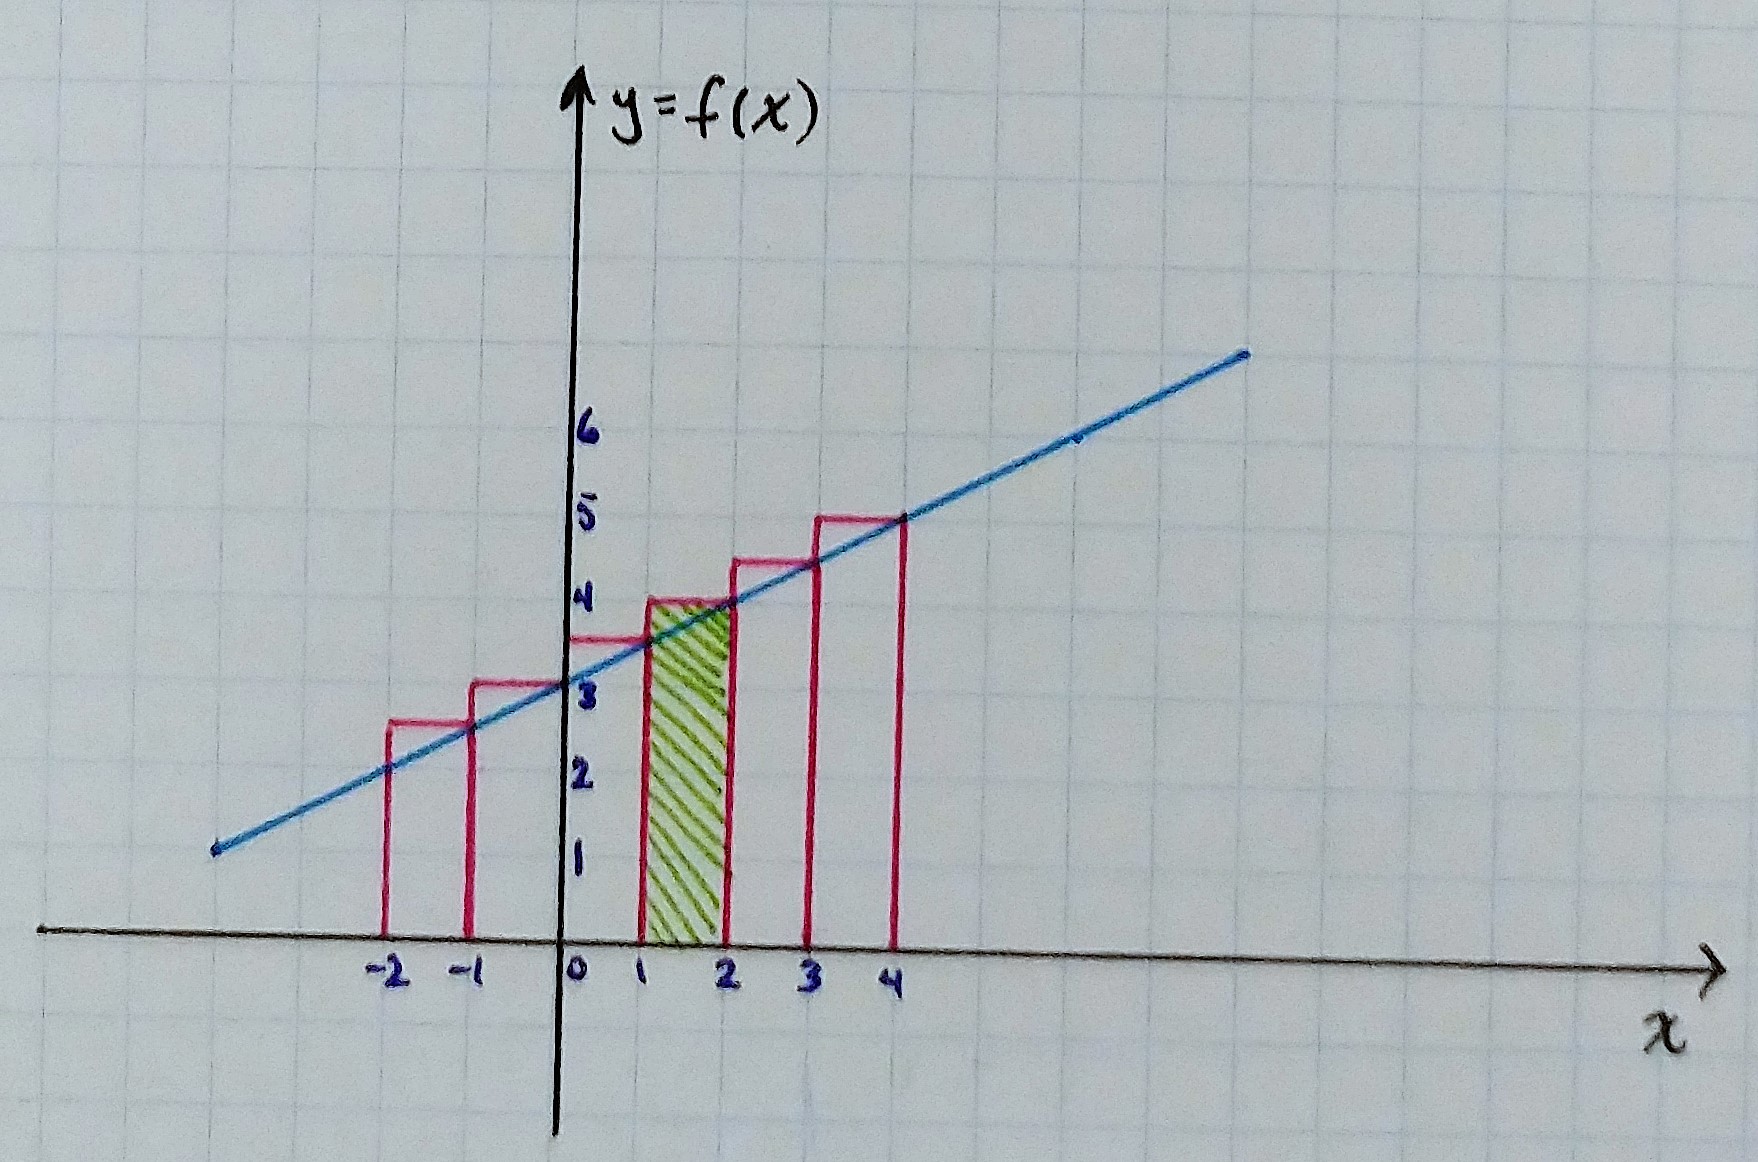
b) Right endpoint rectangles
Another way is to choose the heights to be the function value at the right endpoint. For example, between
In general, for each interval
Using this method, our estimate of the function area is
#sum_(x=–2)^3color(gray)(stackrel"rectangle width"overbracecolor(black)[[(x+1) - x]])*color(gray)(stackrel"height"overbrace color(black)f(x+1))#
# = sum_(x=–2)^3f(x+1)#
With some summation magic, this becomes
# = sum_(x=–1)^4f(x)#
# = f(–1) + f(0) + f(1) + f(2) + f(3) + f(4)#
#=2.5 + 3 + 3.5 + 4 + 4.5 + 5#
#= 22.5#
Bonus:
Since our shape is a trapezoid, the actual area under the graph of
#A=(b_1+b_2)/2 * h#
#color(white)A = (2 + 5)/2 *[4-(–2)]#
#color(white)A = 7/2 * 6#
#color(white)A = 21#
This is exactly halfway between our two calculated estimates. Can you see why?
