Negative values on Position vs Time Graphs and Velocity vs Time Graphs?
I find it challenging to interpret these graphs, specifically negative values. Could someone explain what velocity values below the x axis mean? What do velocity values on the negative side of the y-axis mean?
Also, what do negative position values tell you? Is it going backwards?
I find it challenging to interpret these graphs, specifically negative values. Could someone explain what velocity values below the x axis mean? What do velocity values on the negative side of the y-axis mean?
Also, what do negative position values tell you? Is it going backwards?
1 Answer
My quite lengthy discussion is below.
Explanation:
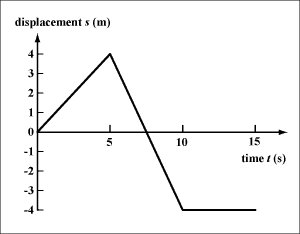
Let's start with the displacement-time graph below

The downward-sloping line from 5 s to 10 s means the object is moving backward. It had been 4 m away from its starting location at t=5 s, but it has moved back to this starting point (by t=7.5 s), then continued backward, until it reached a point 4 m in the opposite direction from where it was at t=5 s. Then, from 10 s onward, it remained at -4 m. Any point below the t=axis means the object is located in the opposite direction from the one it had while the line was above the axis .
In this type of graph, the t-axis represents the location of some (arbitrarily chosen) origin. The object may or may not be starting from here. It is just convenient to designate such a place.
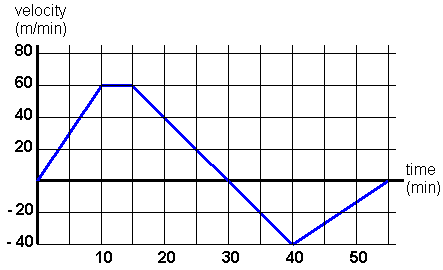
Now for a velocity-time graph (and I agree, they are more challenging to interpret!).

Any point above the time (horizontal) axis is positive velocity, meaning the object is moving forward . (Note the difference with the displacement graph!) The period from 15 min to 30 min for example, shows the object slowing down, but still moving forward.
When this line crosses the t-axis, the object has (momentarily) stopped, and is in the process of changing direction. Negative velocity must mean movement in the opposite direction.
This object then begins to move backward, but is increasing in speed, because we see it going from zero velocity to -40 m/min in the next 10 minutes.
Note that during the entire period from 15 min to 40 min, the object had the same acceleration, as the slope of this line is constant throughout this period. So, going forward, slowing down and going backward, speeding up are both negative acceleration .
From 40 min onward, the object is still moving in reverse (the line is still below the t-axis) but is now reducing its speed, until it stops at t=55 min. Its acceleration is positive while it slows down, backing up.
Finally to your question about points to the left of the "y-axis" - this space contains information about motion that happened before time t=0. Remember that moment t=0 might be considered as the first instant that we began to record information, or maybe it is just an arbitrary moment. If so, events to the left of the vertical axis make sense. They just happened earlier in time.

