Please provide a detailed explanation to this problem?
1 Answer

Explanation:
.
Let's graph these inequalities and take a look at the solution set. To do so, we first turn the inequalities into equations. Then we graph each one. Both are straight lines because they are equations of first degree.
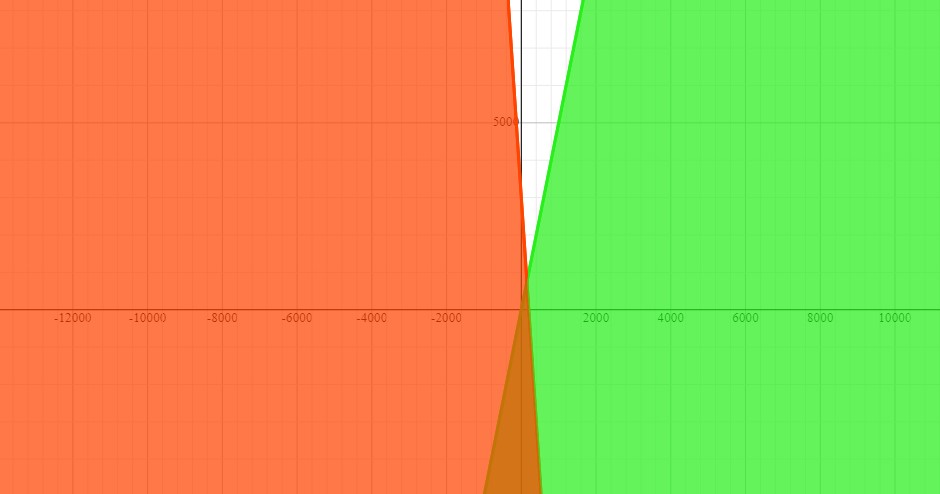
The left edge of the green region is the line whose equation is:
Our inequality is:
This means we are looking for a region that consist of points whose
The right edge of the red region is the line whose equation is:
Our inequality is:
For the same reason as for the other line, we shade the region below the right edge line red.
As you can see the two regions overlap and create the brown region which is the intersection of the red and green regions. This brown region constitutes the solution set for the system of inequalities.
If a point
Since this
Now, we plug this in for
