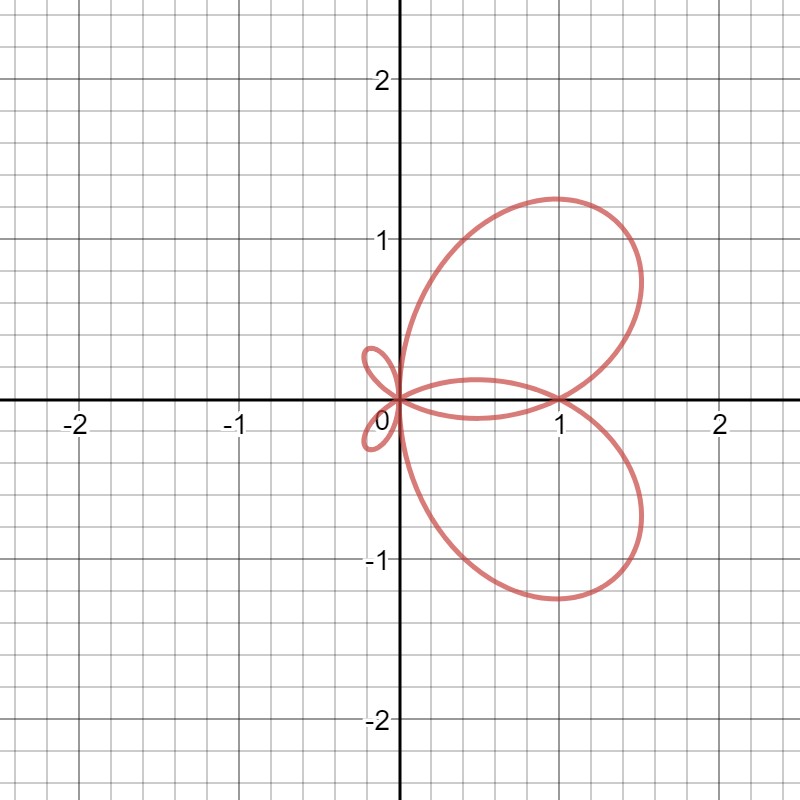
Sketch r = cos(theta) + sin(2theta) with proper justification?
I would appreciate if there is something like a table of values and reasoning behind how you graph it
I would appreciate if there is something like a table of values and reasoning behind how you graph it
1 Answer

Please see below.
Explanation:
.
Since we do not know what it looks lie, let's start with finding its key points. We can find
Similarly, you can continue finding points on the grid by trying more values of
Now, let's see what values of
This means the graph will pass through the origin four times between
Now, let's see what the maximum and minimum values of
Using the quadratic formula: