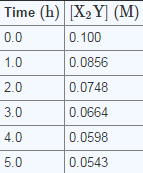
The data below were collected for the following reaction at a certain temperature: #X_2Y→2X+Y# (Data found as picture in answer box). What is the concentration of #X# after 12 hours?
2 Answers


Explanation:
If you plot a concentration time graph you get an exponential curve like this:
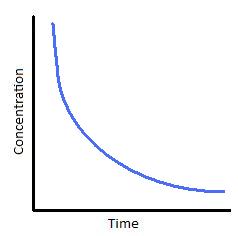
This suggest a first order reaction. I plotted the graph in Excel and estimated the half-life. This is the time taken for the concentration to fall by one half of its initial value.
In this case I estimated the time taken for the concentration to fall from 0.1M to 0.05M. You need to extrapolate the graph to get this.
This gives
So we can see that 12mins = 2 half-lifes
After 1 half life the concentration is 0.05M
So after 2 half-lifes
So in 1L of solution no. moles XY used up = 0.1 - 0.025 = 0.075
Since 2 moles of X form from 1 mole XY the no. moles X formed =0.075 x 2 = 0.15.
So

The concentration of
Explanation:
The values given to you are

In order to be able to determine what the concentration of
- the order of the reaction
- the rate constant
In order to determine the order of the reaction, you need to plot three graphs
#[X_2Y]# versus time, which looks like this
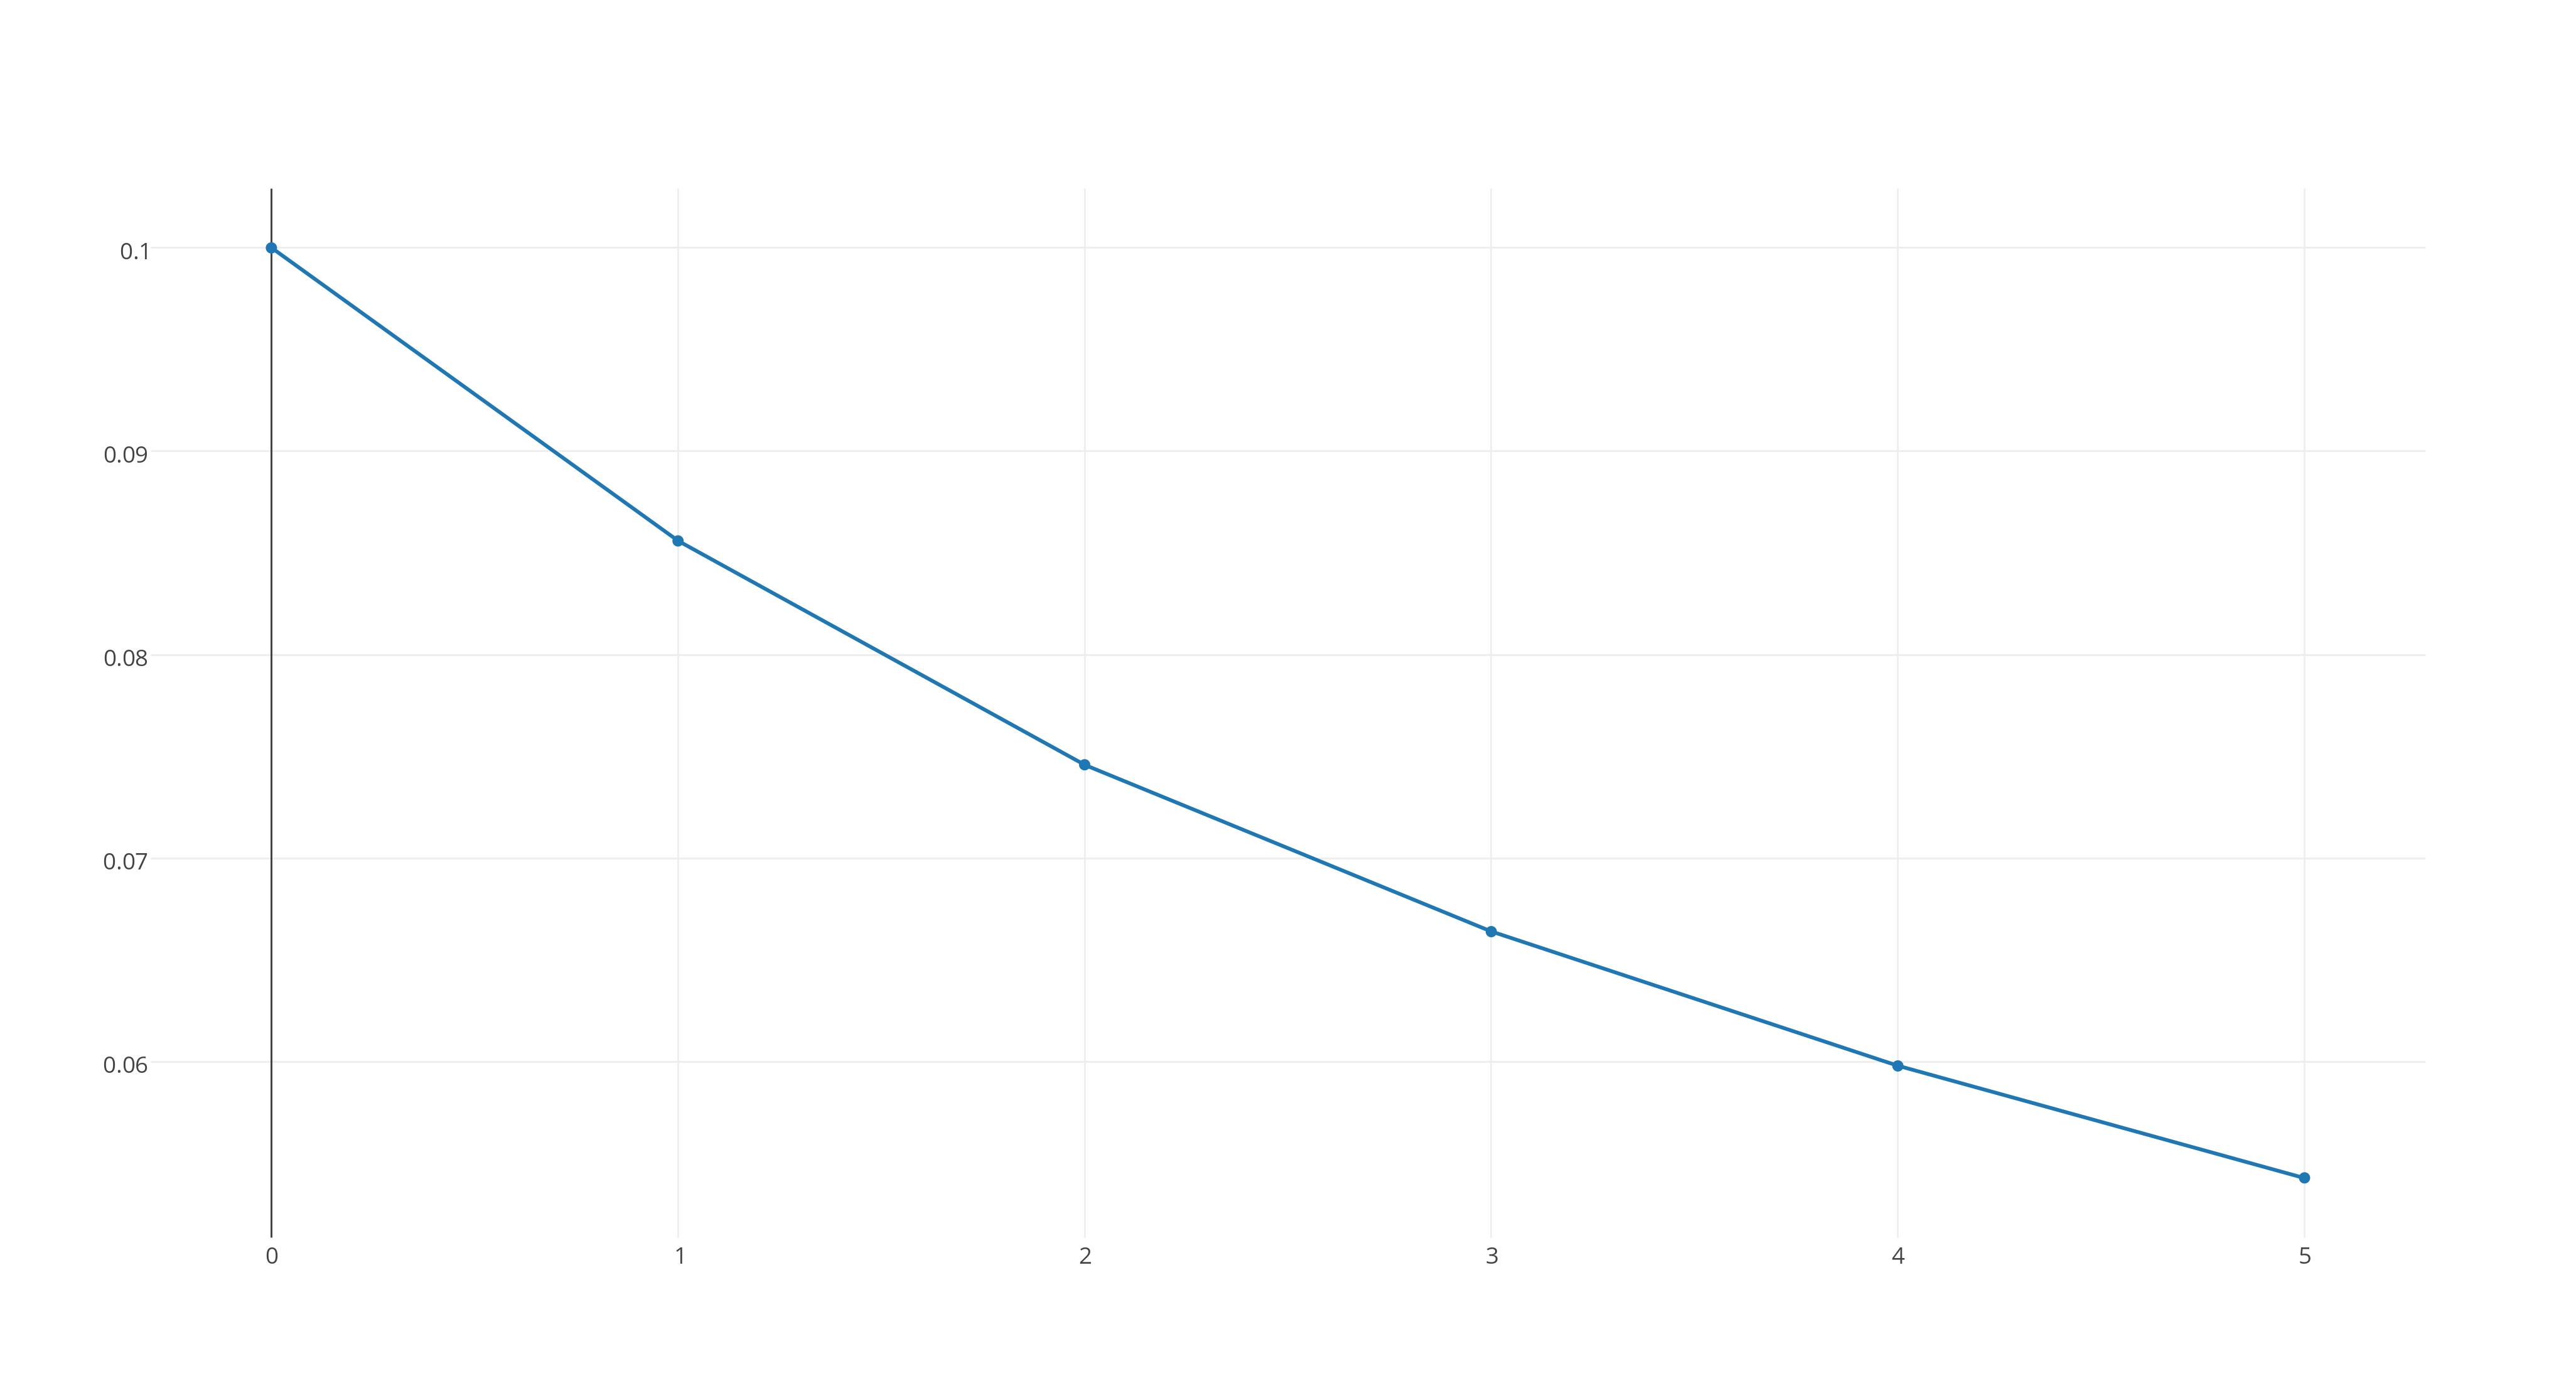
https://plot.ly/~stefan_zdre/3/col2/?share_key=vyrVdbciO8gLbNV6mmucNZ
#ln([X_2Y])# versus time, which looks like this
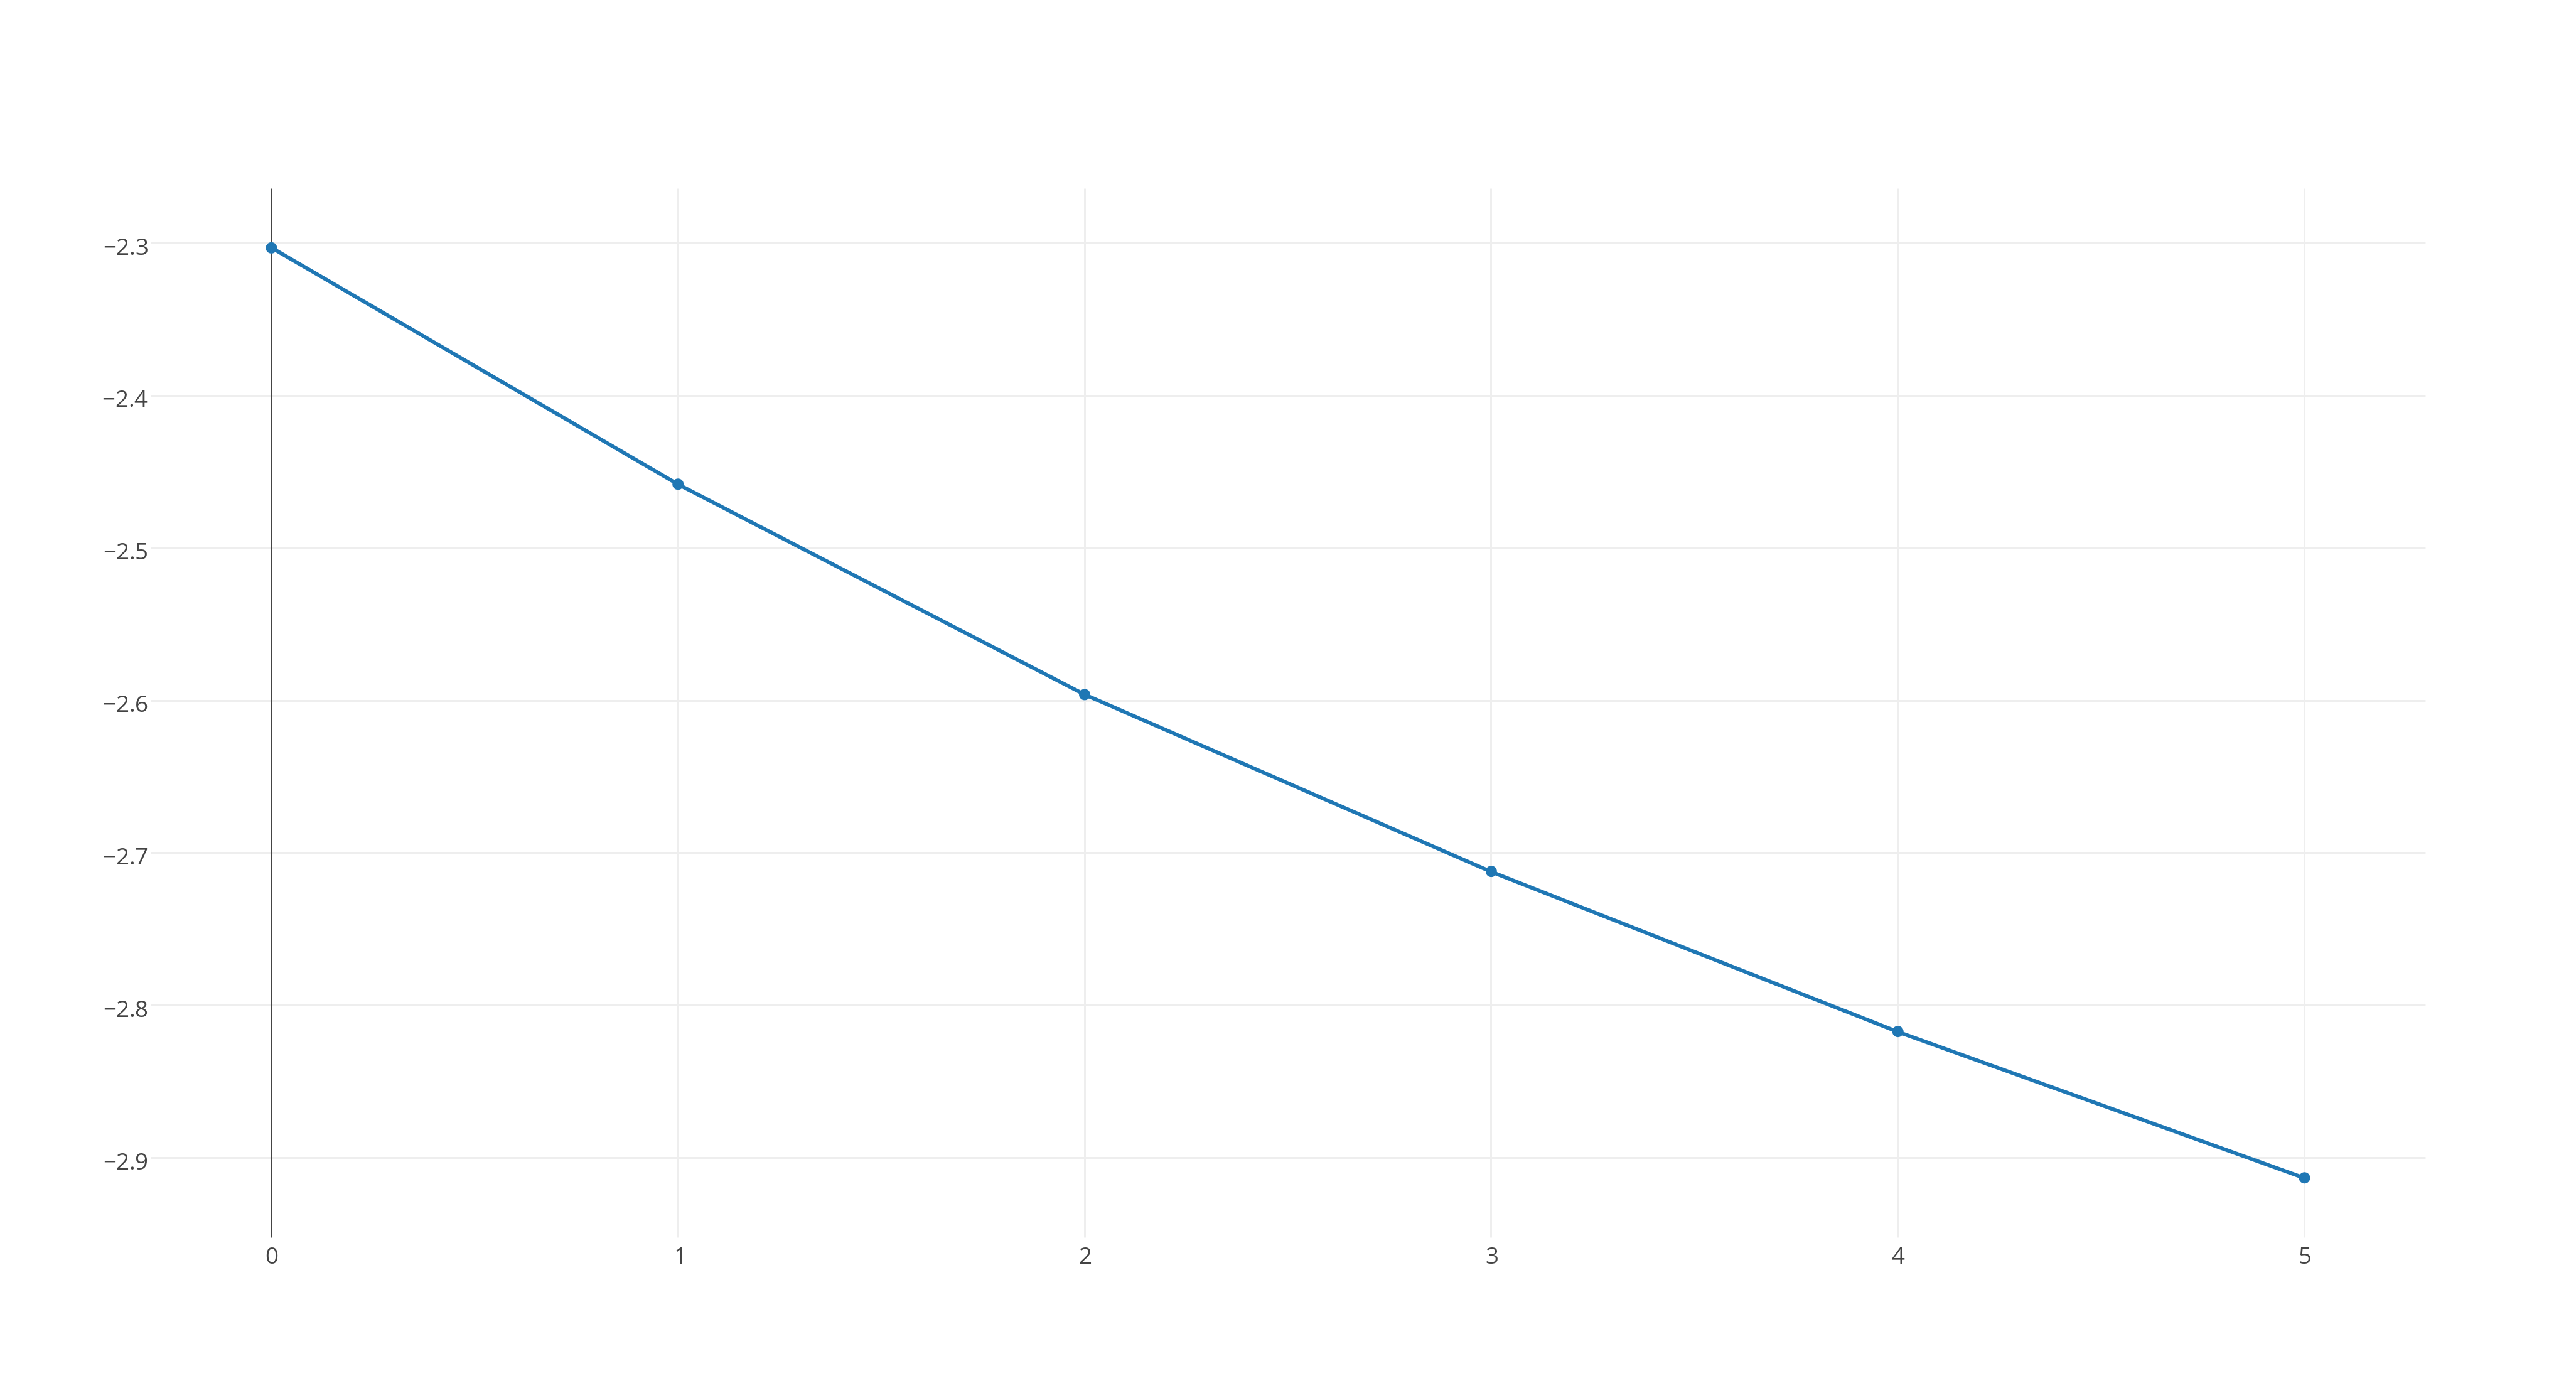
https://plot.ly/~stefan_zdre/17/col2/?share_key=gnsvMoGLJ2NDpZF0dN2B3p
#1/([X_2Y])# versus time, which looks like this
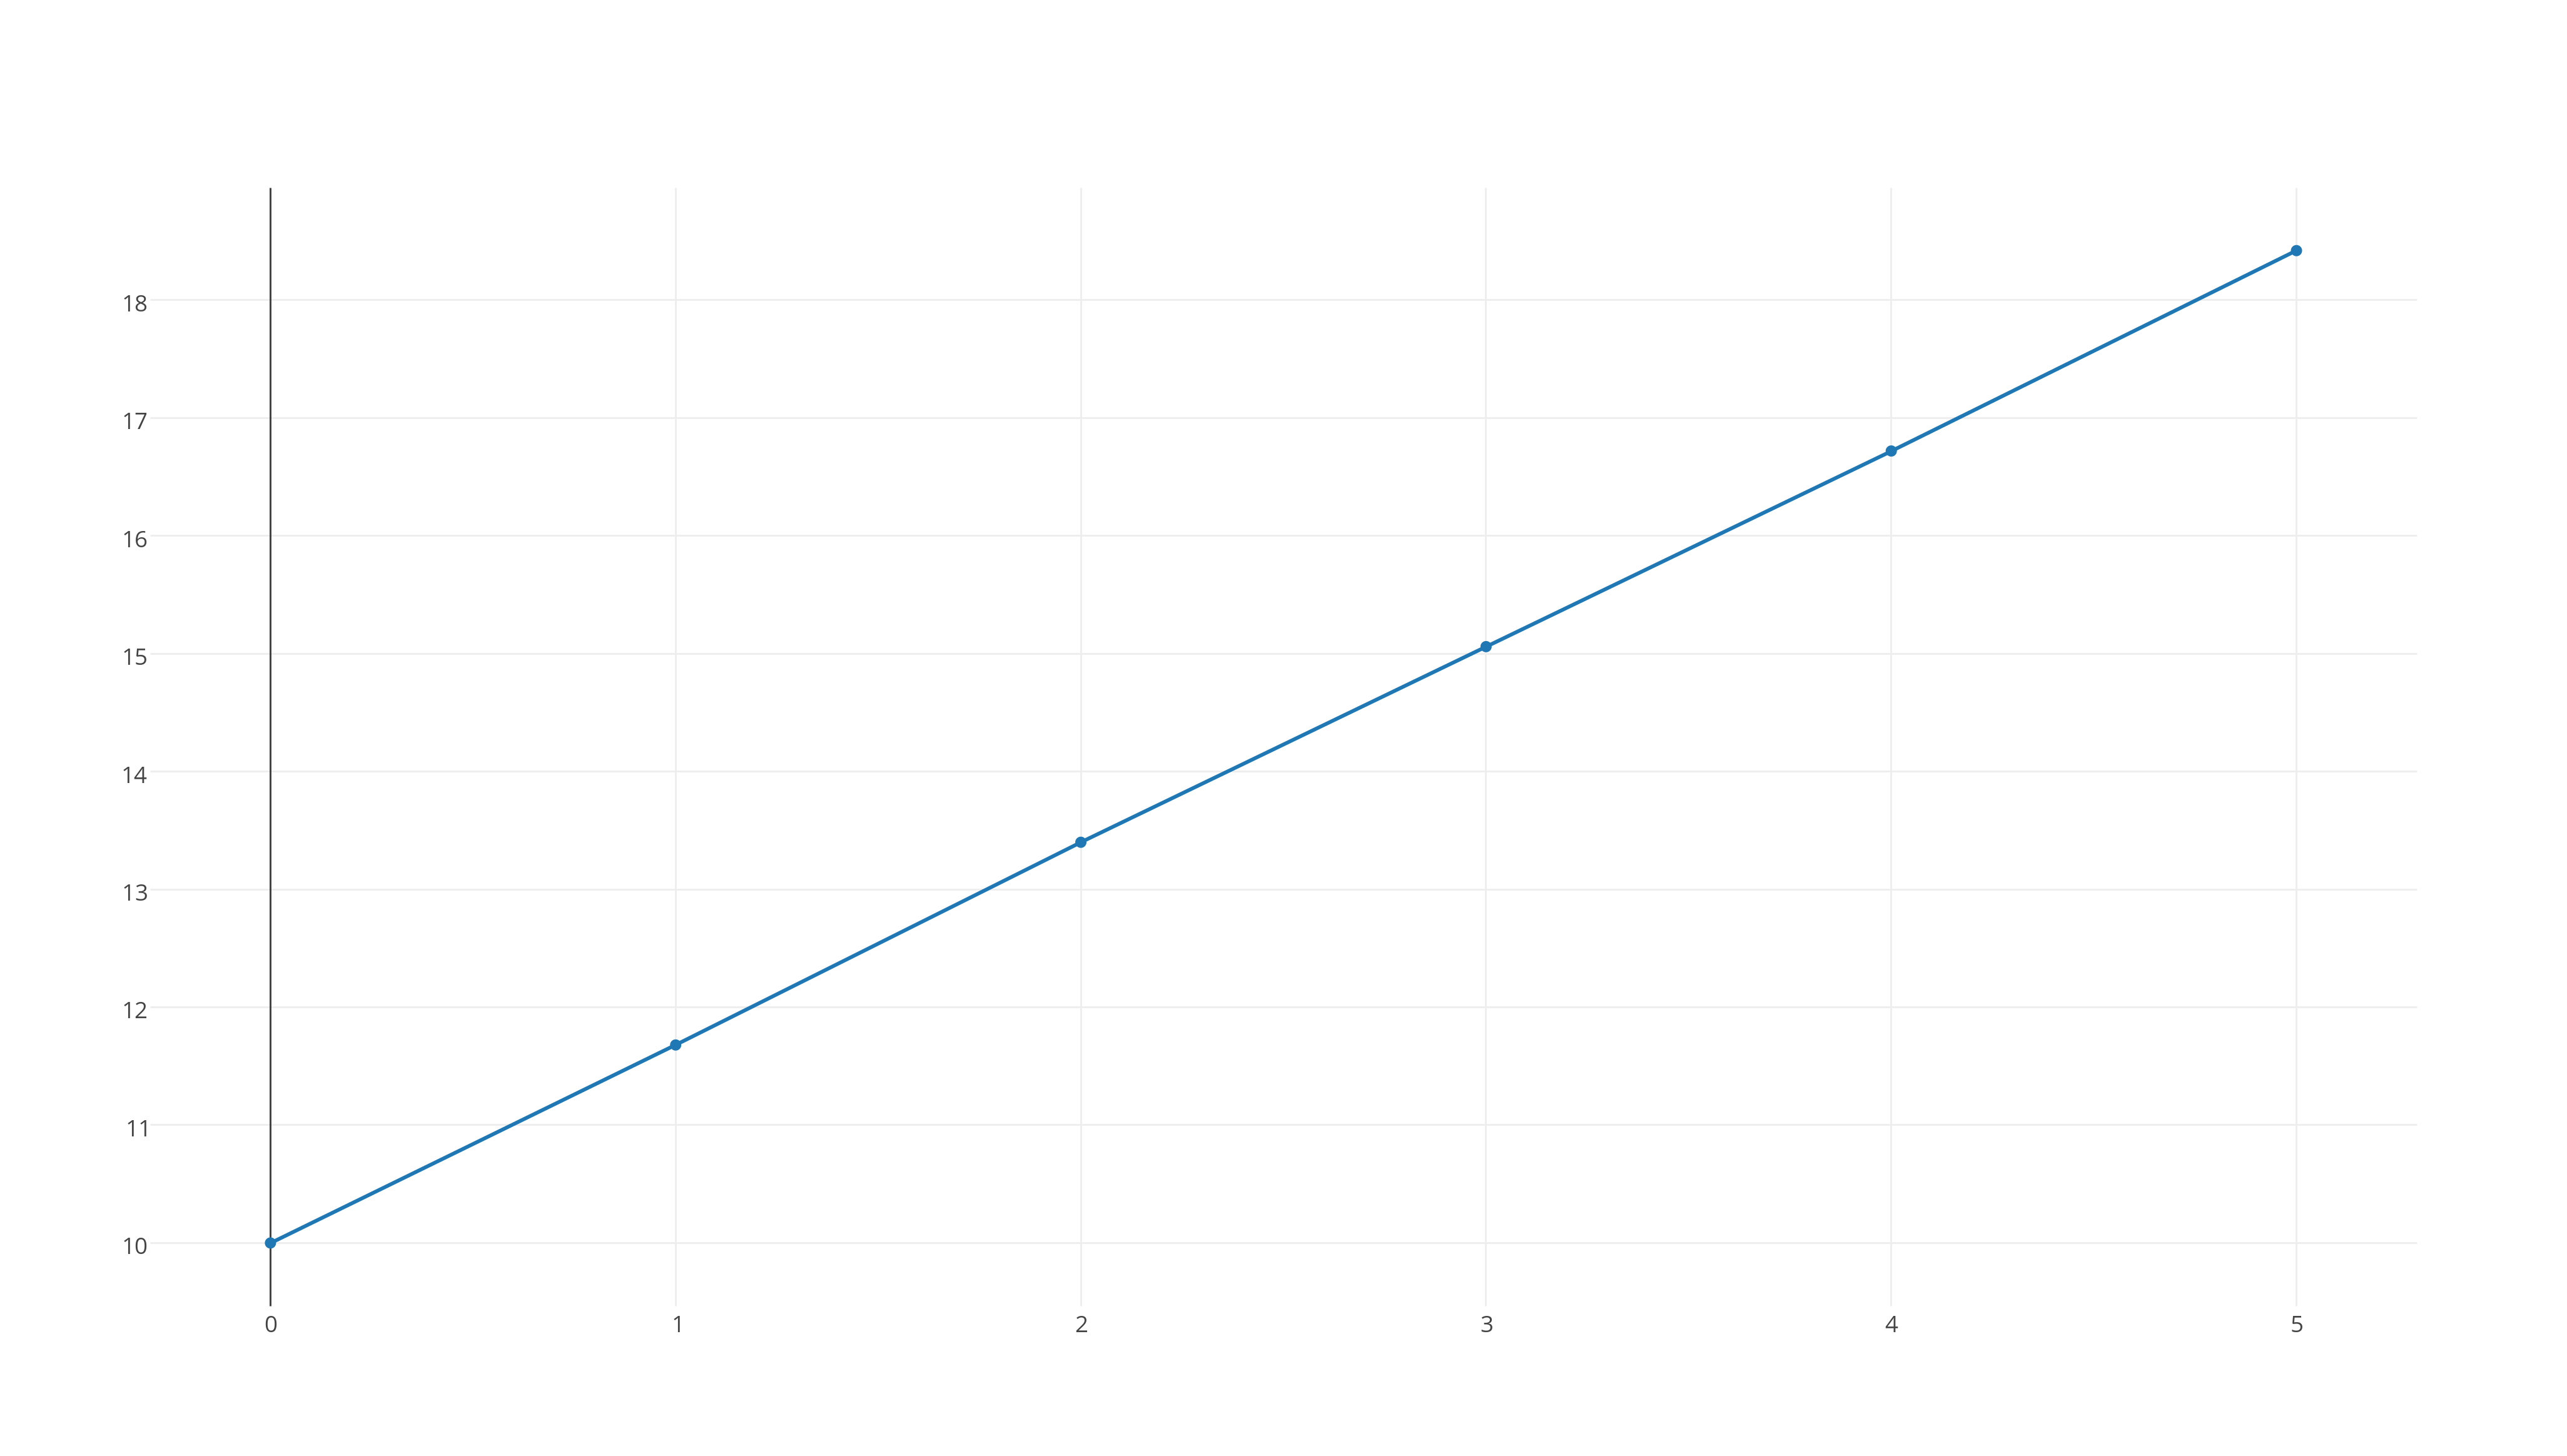
https://plot.ly/~stefan_zdre/7/col2/?share_key=M7By0sY6Wvq0W59uTv8Tv6
Now, the graph that fits a straight line will determine the reaction's rate order. As you can see, the third graph fits this patter, which means that the reaction will be second-order.
The integrated rate law for a second-order reaction looks like this
In order to determine the value of
To make the calculations easier, I'll pick the first and second values. So, the concentration of
Use the same equation to determine what the concentration of
Therefore,
To get the concentration fo
You know that every 1 mole of
This is equivalent to
The number of moles of
For your 1-L sample, this is equivalent to a molarity of
