"The graph of a normal curve is given. Use the graph to identify the values of #\mu# and #\sigma#" ?
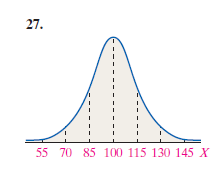
Answer: #\mu=100,\sigma=15#
Issue: Why? Looks like #\sigma=3# to me...
Answer:
Issue: Why? Looks like
1 Answer

EACH division indicated is ONE
Explanation:
Don't confuse the metric with the range used for a desired accuracy. The +/-
In statistics, the 68–95–99.7 rule is a shorthand used to remember the percentage of values that lie within a band around the mean in a normal distribution with a width of two, four and six standard deviations, respectively; more accurately, 68.27%, 95.45% and 99.73% of the values lie within one, two and three standard deviations of the mean, respectively. (Ref.: https://en.wikipedia.org/wiki/68%E2%80%9395%E2%80%9399.7_rule )
See also: http://www.emu.edu.tr/~oyagiz/MGMT585/Six%20Sigma%20vs_%20Three%20Sigma.htm
