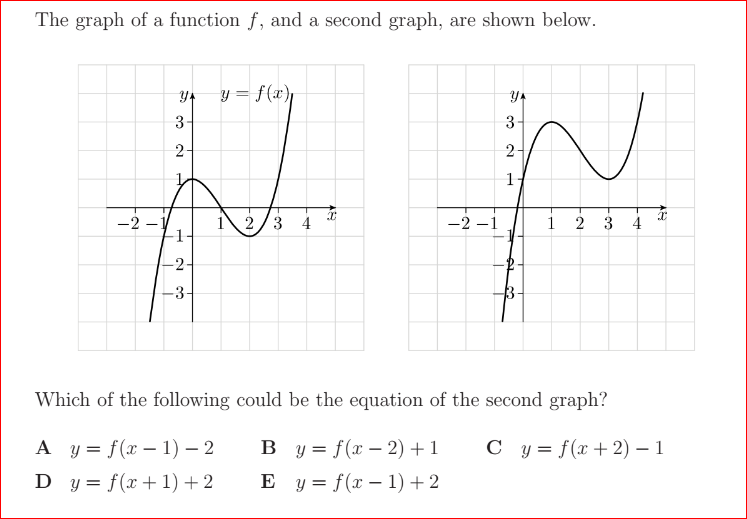
The graph of function f and another is shown below what is the equation of the other?
1 Answer

Dec 31, 2017
Explanation:
.
When you add or subtract a value from your
And when add or subtract a value to your
Here, if you look at an easily identifiable point such as the maximum or the minimum of the function you can see that the other function is the original function of
This means you have to subtract
So, the new function becomes
