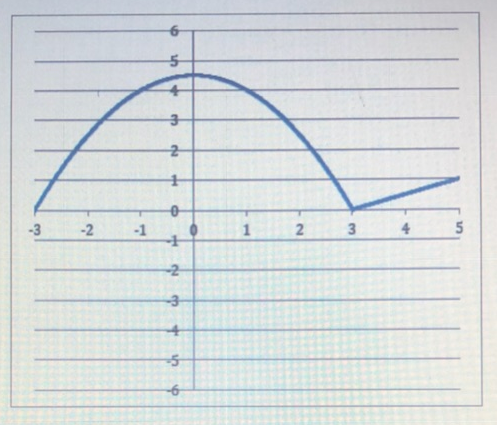
The graph of #y=g(x)# is given below. Sketch an accurate graph of #y=2/3g(x)+1# on same set of axes. Label the axes and at least 4 points on your new graph. Give the domain and range of the original and the transformed function?

enter image source here

1 Answer
Jul 6, 2018

Please see the explanation below.

Explanation:

Before : #y=g(x)#

# "domain" # is #x in [-3,5]#

# "range " # is #y in [0,4.5]#

After : #y=2/3g(x)+1#

# "domain" # is #x in [-3,5]#

# "range " # is #y in [1,4]#

Here are the #4# points :

#(1)# Before : #x=-3#, #=>#, #y=g(x)=g(-3)=0#

After : #y=2/3g(x)+1=2/3*0+1=1#

The newpoint is #(-3,1)#

#(2)# Before : #x=0#, #=>#, #y=g(x)=g(0)=4.5#

After : #y=2/3g(x)+1=2/3*4.5+1=4#

The newpoint is #(0,4)#

#(3)# Before : #x=3#, #=>#, #y=g(x)=g(3)=0#

After : #y=2/3g(x)+1=2/3*0+1=1#

The newpoint is #(3,1)#

#(4)# Before : #x=5#, #=>#, #y=g(x)=g(5)=1#

After : #y=2/3g(x)+1=2/3*1+1=5/3#

The newpoint is #(5,5/3)#

You can place those #4# points on the graph and trace the curve.