The length of a screw produced by a machine is normally distributed with a mean of 0.25 inches and a standard deviation of 0.01 inches. What percent of screws are between 0.24 and 0.26 inches?
1 Answer
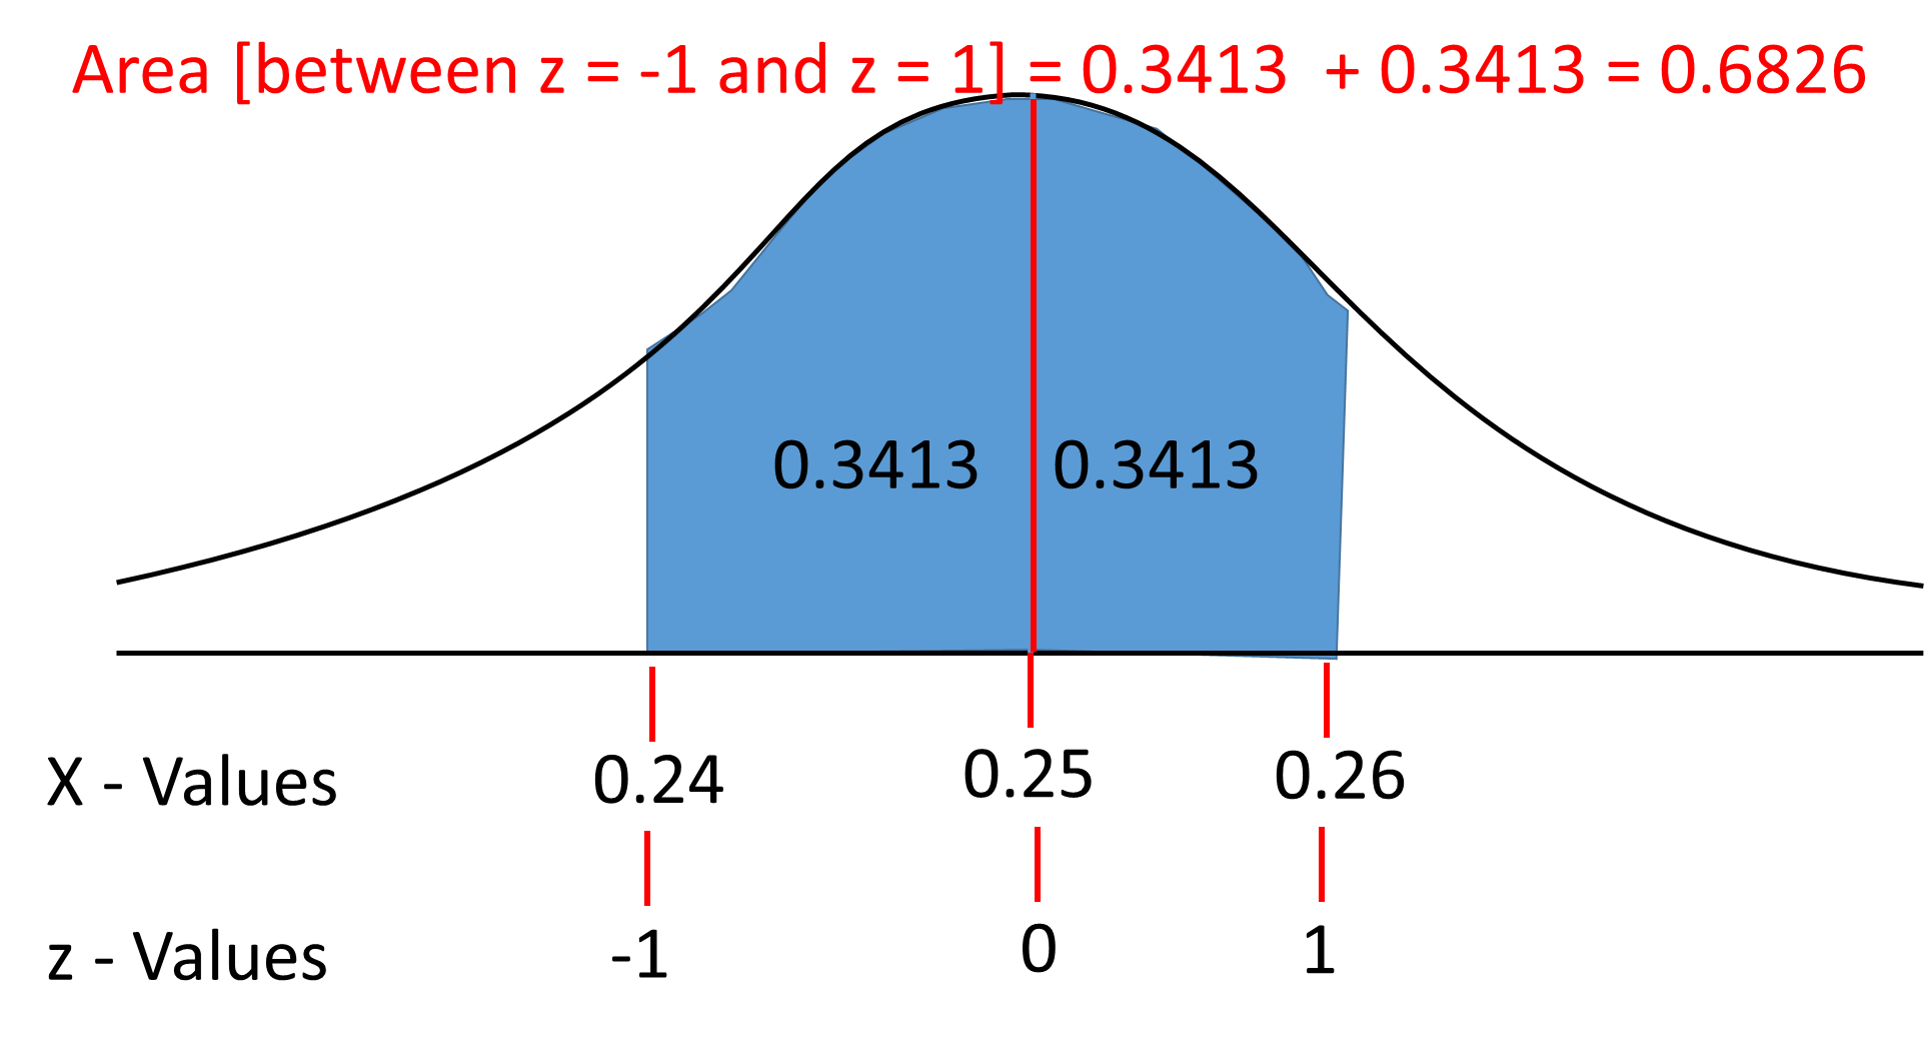
Screws between 0.24 and 0.26 inches = 68.26%
Explanation:
Given -
Mean
SD
Values are normally distributed.
Look at the graph.
Mean is presented exactly at the middle along the X-axis.
The other two
They are also represented along the X - axis.
Their corresponding
At
At
At
Using the Area under Normal Distribution Table you have to find the area between
This is same for
Area between
Area between
If one screw is taken at random the probability of its length fall between 0.24 and 0.26 inches is
Then percentage of screws fall between 0.24 and 0.26 inches is


