The question in the picture below..?
1 Answer

(i)
(ii)
(iii)
Explanation:
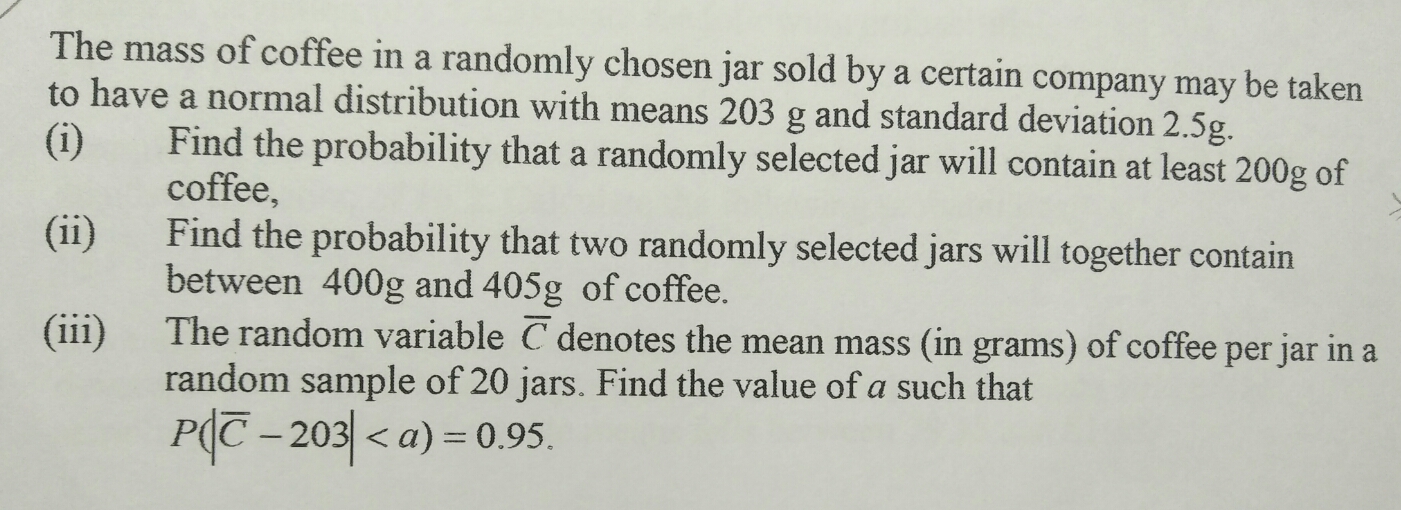
(i) Let
#"P"(C>=200)="P"((C-mu)/sigma >= (200-mu)/sigma)#
#color(white)("P"(C>=200))="P"(Z >= (200-203)/2.5)#
#color(white)("P"(C>=200))="P"(Z >= –1.2)#
#color(white)("P"(C>=200))="P"(Z < 1.2)#
#color(white)("P"(C>=200))=Phi(1.2)#
#color(white)("P"(C>=200))=0.8849" "=88.49%#
(ii) Let
#"P"(400 <= D<= 405)#
#="P((400-406)/sqrt(12.5)<=(D-mu)/sigma <= (405-406)/sqrt(12.5))#
#~~ "P(–1.70 <= Z <= –0.28)#
#=Phi(–0.28)-Phi(–1.70)#
#=0.3897-0.0446#
#=0.3451" "=34.51%#
(iii)
#"P"(abs(barC - 203)< a)=0.95#
#=>2{"P"(0 < [barC - 203] < a)}=0.95#
#=>2{"P"(0 < [barC - 203]/0.3125 < a/0.3125)}=0.95#
#=>"P"(0 < Z < a/0.3125)=0.475#
#=>Phi(a/0.3125)-Phi(0)=0.475#
#=>Phi(a/0.3125)-0.5=0.475#
#=>Phi(a/0.3125)=0.975#
#=>a/0.3125 = Phi^(–1)(0.975)#
#=>a/0.3125=1.96#
#=>a=0.6125#
Note: The value of
Also, the
