Velocity time graph problem?.
1 Answer

May 13, 2018
See below
Explanation:
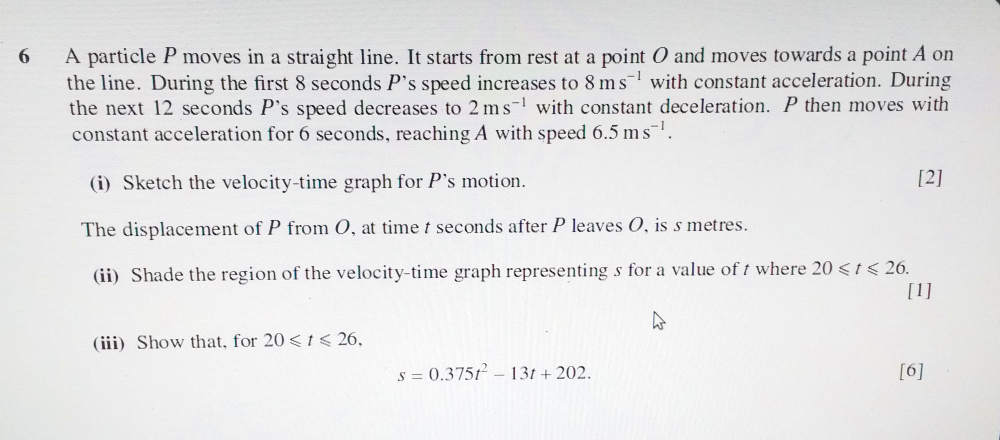
Sketch graph:
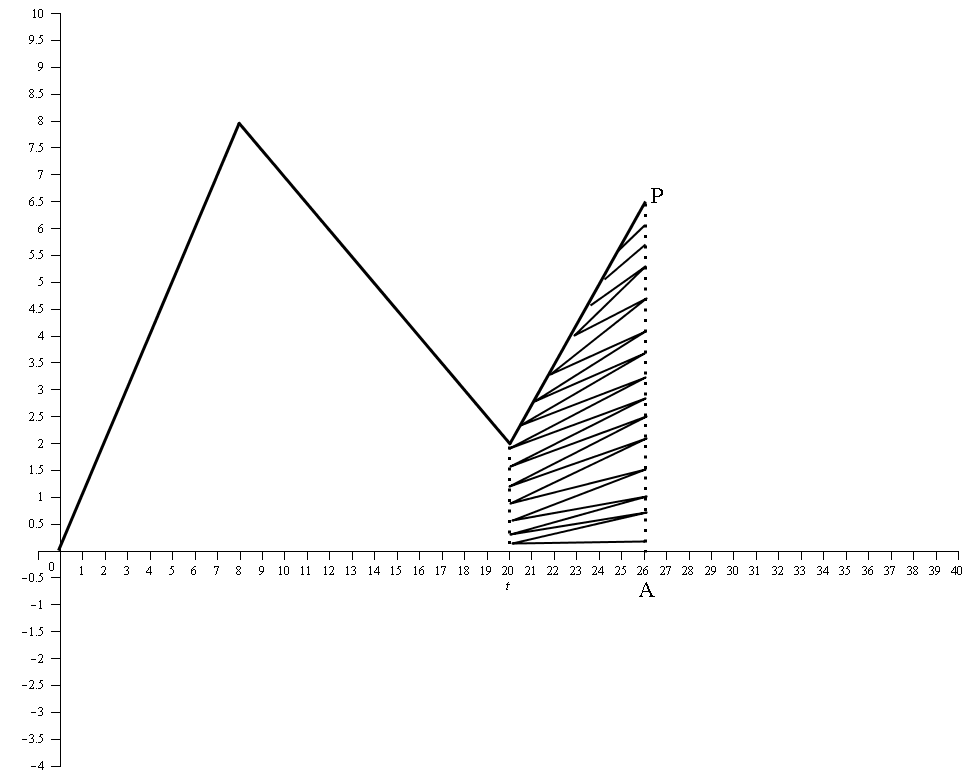
Shade required region:
We are asked the show that the shaded region
Area under graph from
Using:
Distance from
Shown.
