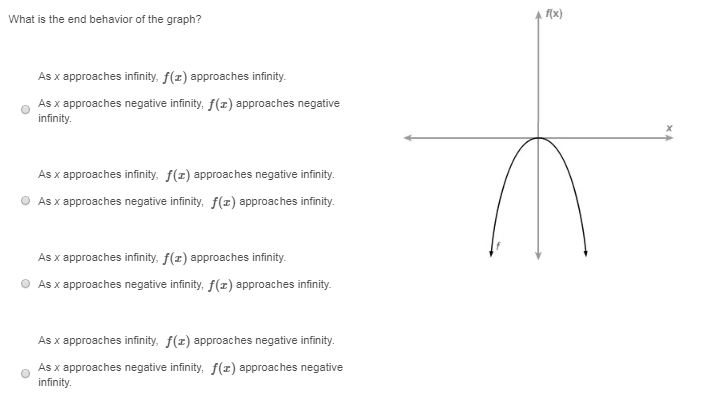
What is the end behavior of the graph? (Please help!)

enter image source here

3 Answers
Nov 13, 2017

4th option:
As #x->oo, f(x)->-oo#
As #x->-oo, f(x)->-oo#

Explanation:

Look at what the graph here is doing.

As x is getting bigger, after the turning point, we see that #f(x)# is getting smaller and smaller; its getting lower and lower on the y-axis. This means that as x gets larger and closer and closer to infinity, #f(x)# is also going to get smaller and closer and closer to #-oo#.

Something similar is true before the turning point. Before this turning point, as x gets lower and further to the left on the x-axis, #f(x)# gets lower and lower, towards #-oo#.

so:
As #x->oo, f(x)->-oo#
As #x->-oo, f(x)->-oo#

Nov 13, 2017

As #x# approaches positive infinity #f(x)# approaches negative infinity

As #x# approaches negative infinity #f(x)# approaches negative infinity

Explanation:

This is the standard form of #y=-ax^2# where #a# is some constant.

This is the same as #(-1)xxaxx x^2#

As #ax^2# is negative the general shape is of form #nn#

As #x# grows then #-ax^2# becomes more and more negative.

For where #x>0#

#y= lim_(x-> + oo)(-ax^2) ->-oo#

For where #x<0#

#y= lim_(x-> - oo)(-ax^2) ->-oo#

as #(-1)xxaxx (-oo)^2color(white)("ddd") ->color(white)("ddd") (-1)xxaxx(+oo)#

Nov 13, 2017

#"see explanation"#

Explanation:

#"as "xto+oo,f(x)to-oodarr#

#"as "xlarr-oo,f(x)to-oodarr#

#"this would indicate the graph of a polynomial of even"#
#"degree with negative leading coefficient"#

#"the answer is the last one on the grid shown above"#
#"in the question"#