What is the equation of this graph/line in y=mx+b form?

1 Answer

May 12, 2018
See the explanation
Explanation:
If you rank in order of sleep time there is a loose association that appears to follow a straight line (with a degree of variation)
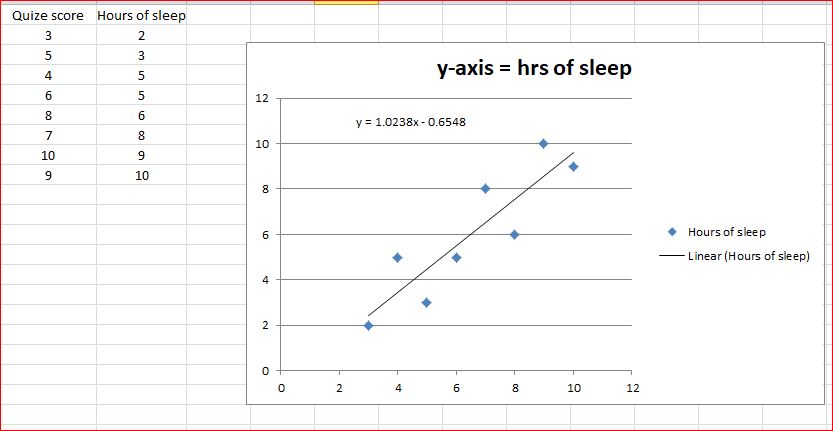
Letting Excel derive it for me we have:
Where
There is a way to actually calculate this using calculus and I covered it at university but do not wish to go that deep.
