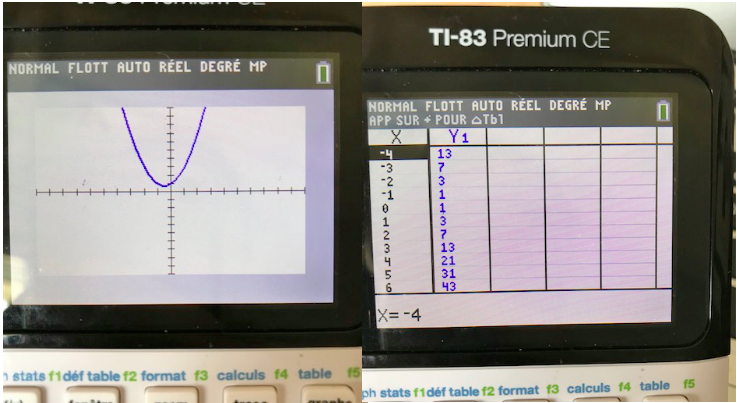
What is the graph for # y=x^2+x+1# ?
1 Answer
May 28, 2018
The equation itself gives you the answer for how it is supposed to look:
Explanation:
All you have to do is choose a sequence of numbers (negatives and positives) for the x value and replace them in the equation:
if we replace the xs with a -4 for example, y will equal 13, and so on and so on. Some calculators can do that for you if you just put in the equation:

