What is the graph of #y=cos(x-pi/2)#?

1 Answer

First, the graph of #y=cos(x-pi/2)# will have some characteristics of the regular cosine function.
I also use a general form for trig functions: #y = a cos(b ( x - c)) + d# where |a| = amplitude, #2pi/|b|# = period, x = c is the horizontal phase shift, and d = vertical shift.

1) amplitude = 1 since there is no multiplier other than "1" in front of the cosine.

2) period = #2pi# since the regular period of cosine is #2pi#, and there is no multiplier other than a "1" attached to the x.

3) Solving #x - pi/2=0# tells us that there is a phase shift (horizontal translation) of #pi/2# to the right.
Wave graph with math formulas.

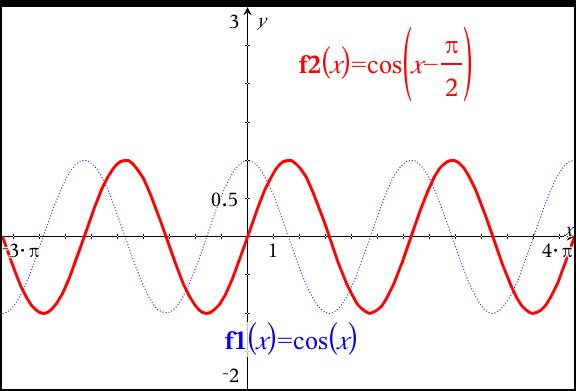
The bright, red graph is your graph!
Compare it to the dotted, blue graph of cosine. Do you recognize the changes itemized above?