What is the Hertzsprung–Russell diagram?
1 Answer

A Hertzsprung-Russell diagram plots the luminosity of stars against their surface temperature. They are helpful for classifying stars and for finding the age of star clusters.
Explanation:
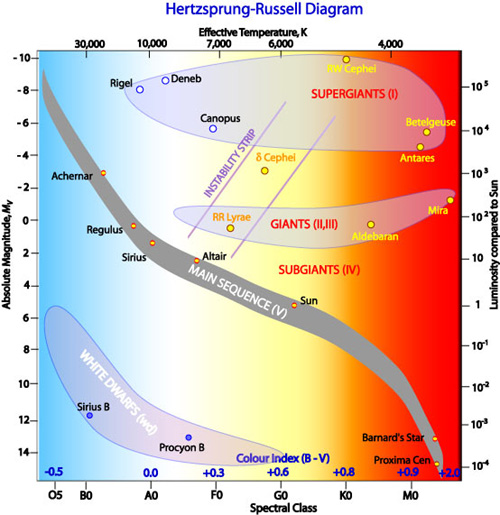
The Hertzsprung-Russell diagram was developed independently by Ejner Hertzsprung and Henry Norris Russell. Hertzsprung plotted stars' absolute magnitude against their temperature, while Russell plotted luminosity against spectral class.
The majority of all stars show up on a strip running from the top left to the bottom right called the main sequence. These are stars like our sun which are fusing hydrogen into helium. All stars spend most of their life on the main sequence strip. If a star begins to fuse heavier elements, it will move off of the main sequence toward the top right of the diagram to become a giant or supergiant star.
Since hotter main sequence stars will begin fusing helium sooner than cooler main sequence stars, H-R diagrams can be used to find the age of star clusters. Stars in a cluster will often form at around the same time, so they are roughly the same age, and since we can predict the life span of stars based on size, we can tell how old the cluster is by looking at which stars are just beginning to leave the main sequence.
In the image above, the youngest cluster is on the left and the oldest is on the right. Notice that the very hot luminous stars begin to move to the giant stage first. These are the most massive, and therefore shortest lived stars.
