What is the solution (graphing) to #x=-3# and #y=5# ?

1 Answer
May 17, 2018

#(-3,5)# is the solution to graphing #x=-3 and y=5#

Explanation:

So when you are graphing this on paper, you want to plot these points even though they have no x or y value. So for x=-3, you plot that on the x-axis at -3 but since #x= -3# you need to draw a straight vertical line that goes up and down.

Now for #y=5# you do the same of plotting it at the y-axis on 5 but this time, you draw a horizontal line going left and right.

This is what the graph will look like:
Desmos - Graphing Calculator

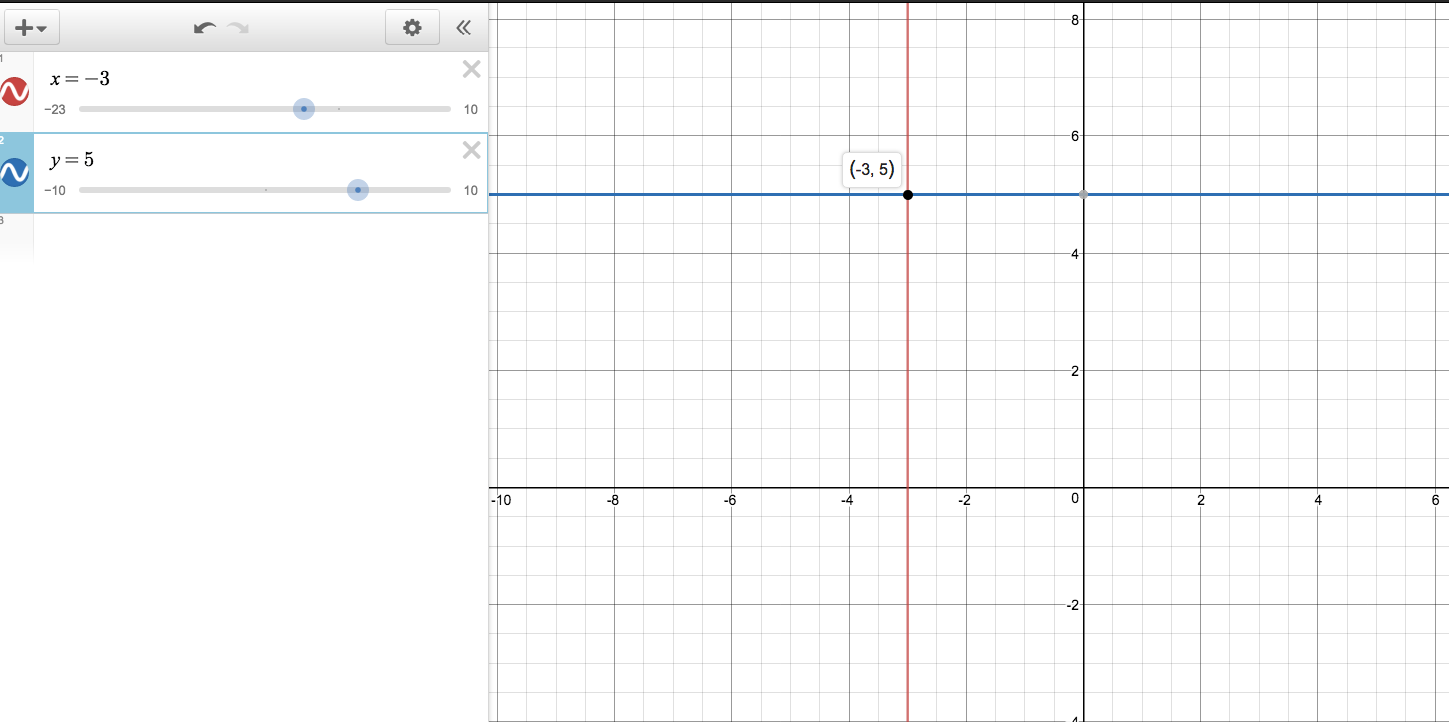
So when graphing both #x=-3 and y=5#, we see that they intersect at a spot which is #(-3,5)#. So the solution to this graph is #(-3,5)#.