What is the voltage-time graph for an inductor when the switch closes?
The potential difference between the inductor is the emf of the source when t=o, so how does the p.d. vary until the steady state current?
The potential difference between the inductor is the emf of the source when t=o, so how does the p.d. vary until the steady state current?
1 Answer
Explanation:
This equation gives voltage (
At time
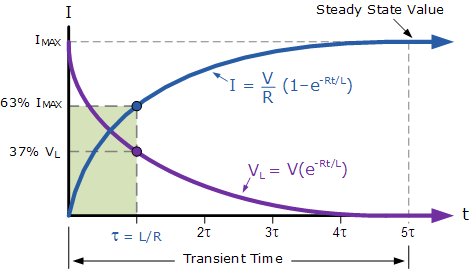
As time increases the voltage over the inductor decreases exponentially, and the voltage across the series resistance increases exponentially.
Voltage across the resistor:
The graph of these voltages is below.

Source https://www.electronics-tutorials.ws/inductor/lr-circuits.html
The blue line represents
Note that if

