What would the f' and f" graphs look like?
Shown below if a graph of function f, a fourth degree polynomial function. On
the axes shown sketch, approximately, the graphs of f'and f" .

Shown below if a graph of function f, a fourth degree polynomial function. On
the axes shown sketch, approximately, the graphs of f'and f" .
1 Answer
The x coordinate of the point in the center is clearly 0.
Let the x coordinate of the point on the left be
Let the x coordinate of the point on the right be
These x coordinates are the zeros of
Writing
Multiply the factors:
To give you an idea of the shapes of the two derivatives, I have graphed,
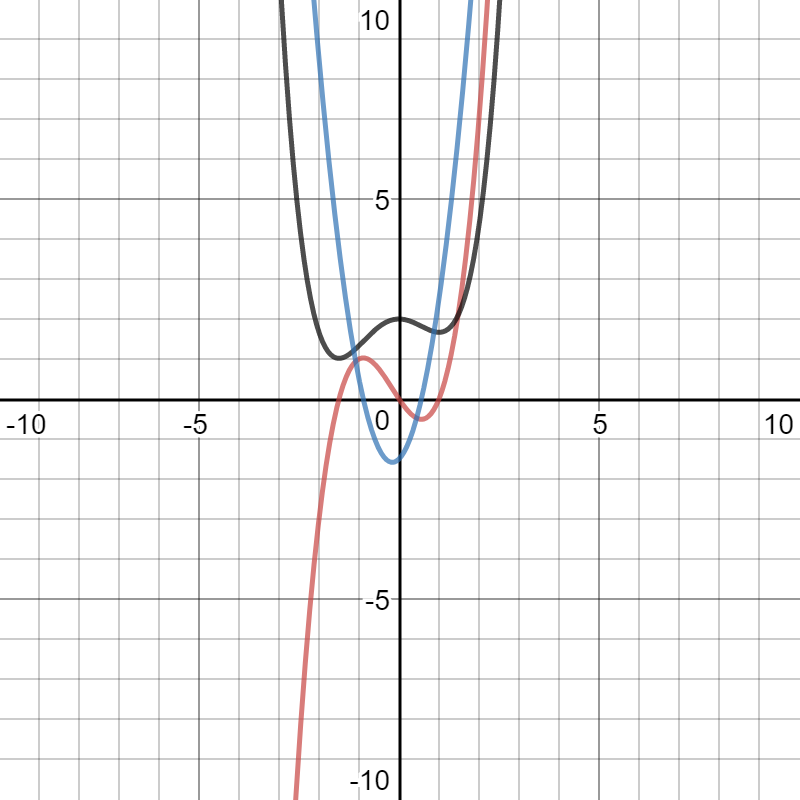
In an attempt to make
