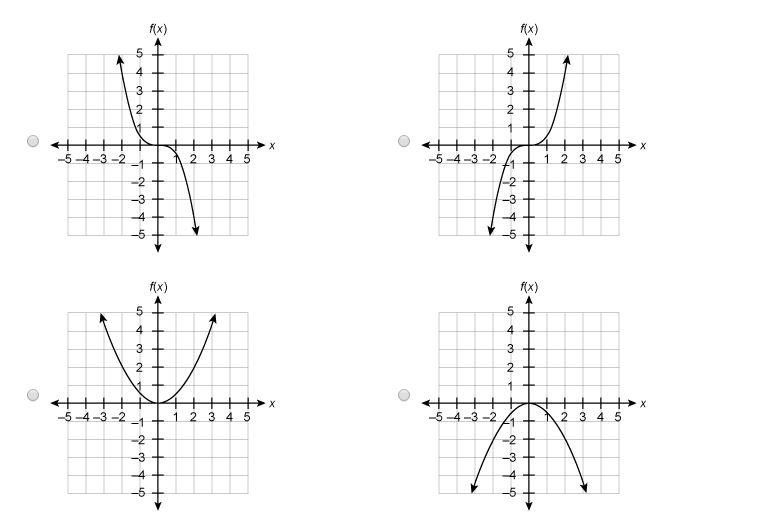
The graph is a cubic, which we can tell from the highest power of x being #x^3#. This immediately rules out the bottom two graphs, since these are quadratic (highest power of x is #x^2#)
This means we have the two top graphs to choose from. Since the coefficient of #x^3# is negative (#-1/2#), this means the graph we are plotting comes from the top left to the bottom right. This fits with the graph in the top right .
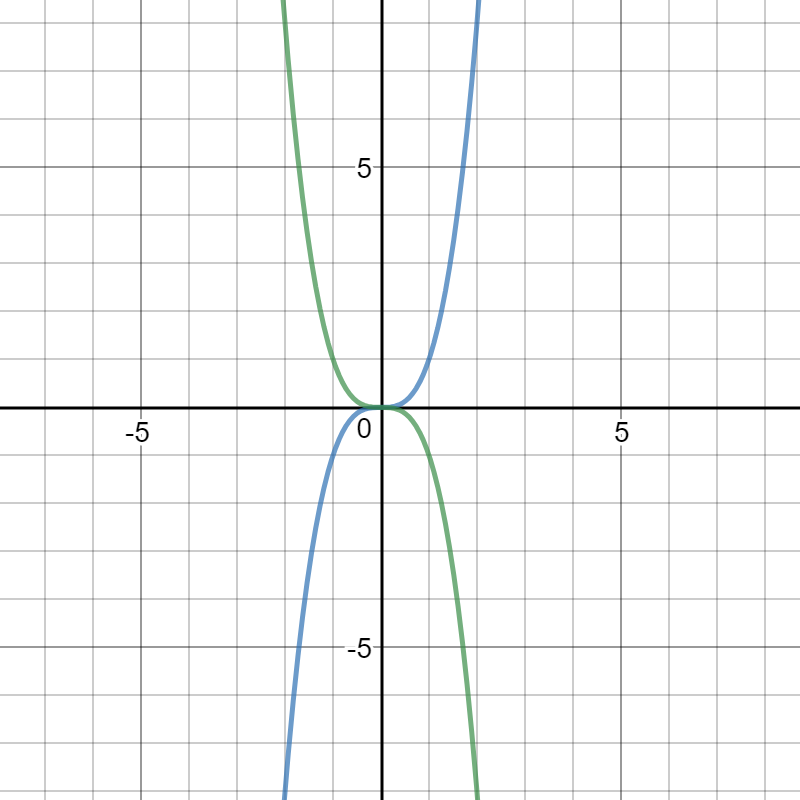
This graph shows #color(blue)(y=x^3)# and #color(green)(y=-x^3)#.
We don't have them multiplied by #1/2#, but the overall shape of the graphs is roughly the same. Note the shape and gradients of the graphs; #color(blue)(y=x^3)# has a gradient which is increasing as x increases, while #color(green)(y=-x^3)# has a gradient which decreases as x increases.