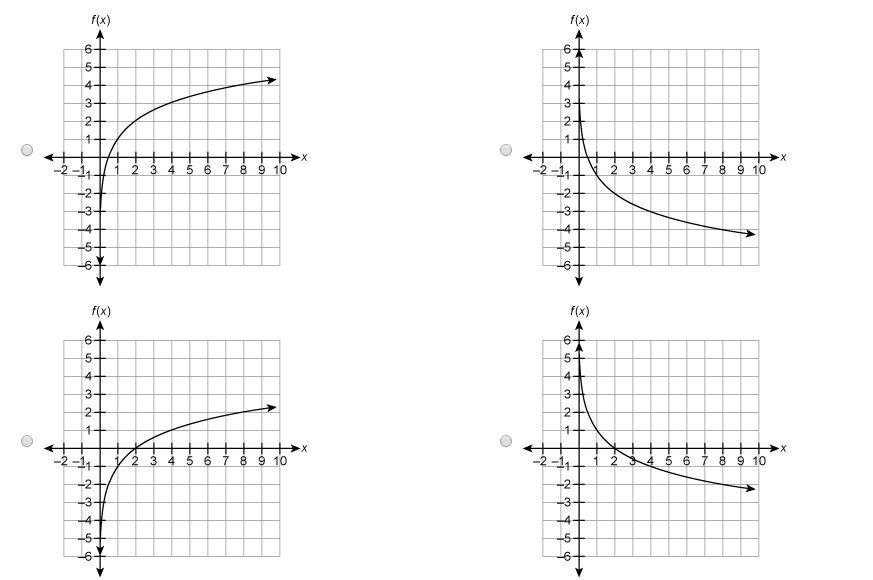
Which graph represents f(x)=log2 x+1 ?
1 Answer

The very first graph represents the graph of
Explanation:
I assume you meant
First of all, we see that this function is concave. Basically, any line segment that connects two points on the graph will be below the graph itself. This already eliminates the two right options.
When we want to graph a function, finding its roots is most useful. The roots are solutions of the equation
As such, the graph intersects the x-axis at
On the first option, we see that
Which is exactly what we needed. However, let's not jump to conclusions already. At the point
In the lower graph, we see that the function is
Therefore, the first graph represents the function
