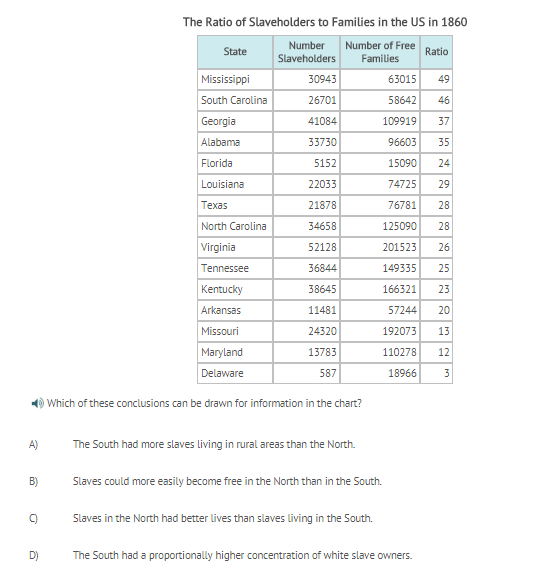
Which of these conclusions can be drawn for information in the chart?
1 Answer

D.
Explanation:
The states at the top of the chart are the states Mississippi farthest to the south. The states at the bottom of the chart (Delaware) are the farthest to the north.
o
D. is the correct answer as the states become farther north the percentage of slave owners goes down. ( there is one flaw in the answer, not all of the slave owners were white. There were free blacks in Mississippi, and Native Americans in Texas and Arkansas that owned slaves.
A. is wrong the the chart provides no information on the location of the slaves and either rural or urban. ( Actually there were more slaves in the rural farming areas than there were slaves in the urban locations. )
B. is true it was much easier for a slave to escape from freedom from a northern state like Maryland than from the deep south like Mississippi but this not reflected in the chart.
C. is true. Because the slaves could more easily escape and social pressure from the neighboring free states slaves were treated better in the northern states. However this is not reflected in the chart.
