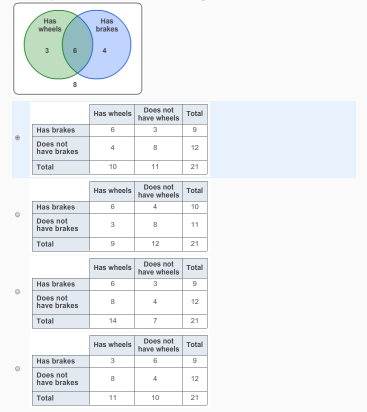
Which two-way table contains the same information as the Venn diagram?
2 Answers

The second option
Explanation:
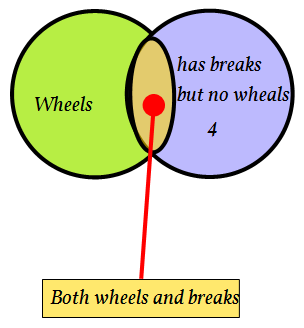
The Venn diagram visually represents the number of things that fit a certain category. The green circle, in this case, represents things that have wheels. The blue circle, in this case, represents things that have brakes. Notice that there is an overlap, though, which represents things that have wheels and brakes. The area in neither of the shape (outside of the two circles) represent things that do not have wheels and do not have brakes.
Now, notice that there are two numbers in the green circle,
In the blue circle, the number
Now, finally, the outside region has the number
Looking at the table, the only option that works is the second option.

2nd table down
Explanation:
The second table down is the only one that has a count of 4 in the category of: has breaks but does not have wheels
That is: first row and middle column has the value of 4