What are dependent variables?
2 Answers

Dependent variables are properties that change in response to a change in another property.
Scientists try to determine if a change to one property causes something else to change in a predictable way.
These changing quantities are the variables.
The independent variables are the ones that are tested to see if they are the cause.
The dependent variables are the properties that change when the independent variables change.
For example, you want to find out if you can use a person’s height to determine arm span.
You collect a sample of people and measure their heights (the independent variable). Then you measure their arm spans (the dependent variable). Is a change in the independent variable related to a change in the dependent variable?
To answer this question, you plot a graph with the independent variable along the x-axis and the dependent variable along the y-axis. Your graph might look like this.
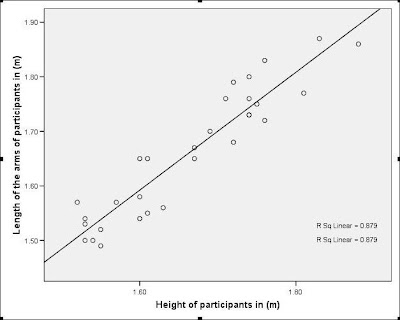
You can draw a “best fit” line through the points. This indicates that the dependent variable (arm span) depends on the person’s height.
Dependent variables are properties that change in response to a change in another property.
Scientists try to determine if a change to one property causes something else to change in a predictable way.
These changing quantities are the variables.
The independent variables are the ones that are tested to see if they are the cause.
The dependent variables are the properties that change when the independent variables change.
For example, you want to find out if you can use a person’s height to determine arm span.
You collect a sample of people and measure their heights (the independent variable). Then you measure their arm spans (the dependent variable). Is a change in the independent variable related to a change in the dependent variable?
To answer this question, you plot a graph with the independent variable along the x-axis and the dependent variable along the y-axis. Your graph might look like this.
You can draw a “best fit” line through the points. This indicates that the dependent variable (arm span) depends on the person’s height.
