What is the graph of the function y=3x-2?
1 Answer

Oct 4, 2014
This is a linear equation, the graph of a line.
This function is in slope intercept form,
In this example the slope is
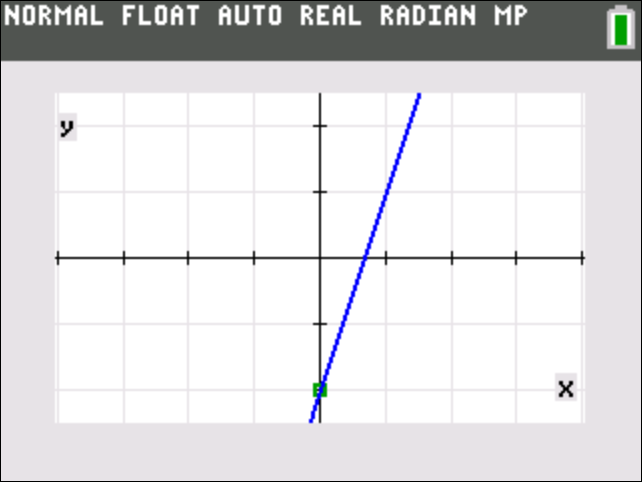
If you are graphing by hand you would start by placing a point on the y-axis at position
From point
Or
From point
Notice the green box that is placed on the starting point