It's often used as a population model and it's a step up in complexity and accuracy from an exponential growth model. An exponential growth model assumes the relative growth \frac{\frac{dP}{dt}}{P} of a population is constant, which is unrealistic in the long run, whereas logistic growth assume the relative growth \frac{\frac{dP}{dt}}{P} can be thought of as a linearly decreasing function of P, say \frac{\frac{dP}{dt}}{P}=k*(1-\frac{P}{L}), so that \frac{dP}{dt}=kP(1-\frac{P}{L}). The constant L is called the carrying capacity of the environment.
If you solve this differential equation using separation of variables and the initial condition P(0)=P_{0}, you'll get P(t)=\frac{P_{0}Le^{kt}}{P_{0}e^{kt}+L-P_{0}}=\frac{L}{1+\frac{L-P_{0}}{P_{0}}e^{-kt}}. This can also be written as P(t)=\frac{L}{1+e^{-k(t-t_{0})}}, where \frac{L-P_{0}}{P_{0}}=e^{kt_{0}. Note that P(t_{0})=\frac{L}{2}.
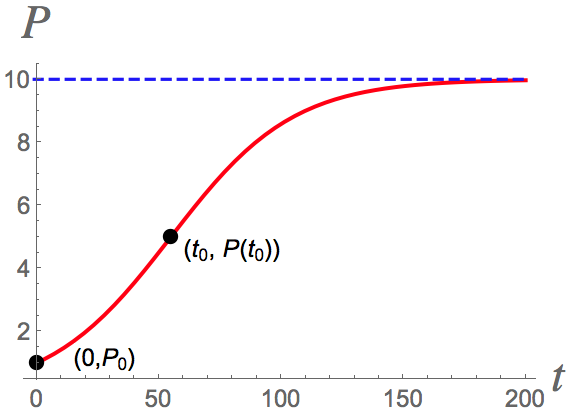
For 0 < P_{0} < L, the graph of P(t) is an increasing function of t that looks somewhat like an elongated "S" (the technical name for the shape is "sigmoidal") with \lim_{t\rightarrow\infty}P(t)=L. It turns out that t_{0}=\frac{1}{k}ln(\frac{L-P_{0}}{P_{0}}) is the time when the graph of P(t) has an inflection point (changing from concave up to concave down). See the figure below.