Question #d3399
1 Answer

Apr 10, 2015
More information is required - I will try to answer based on the information you gave me
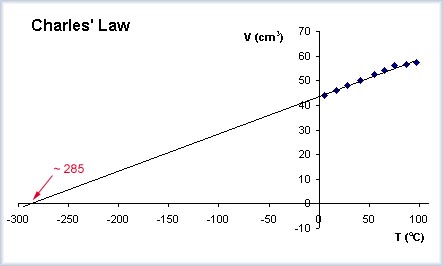
I have done experiments with gases (Charles Law - relating volume to temperature and Admonton Law - relating pressure to temperature) where the plots produce straight lines that can be extended to extrapolate a value for absolute zero.
The graph shows this. The points represent experimental data collection (the volume of a fixed mass of gas at different temperatures). The trend line for these points is extended to find the temperature where the volume is zero - this is an approximation of absolute zero.
In this case, it is the X intercept value