How do you construct a histogram using the data 12, 13, 21, 27, 33, 34, 35, 37, 40, 40, 41?
1 Answer

Jun 7, 2015
We have the data set
1) Transform it into an ordered data set:
2) The data points range from
3) Split this data range into convenient equal intervals: for example, we can use 6 intervals with the interval step of 5:
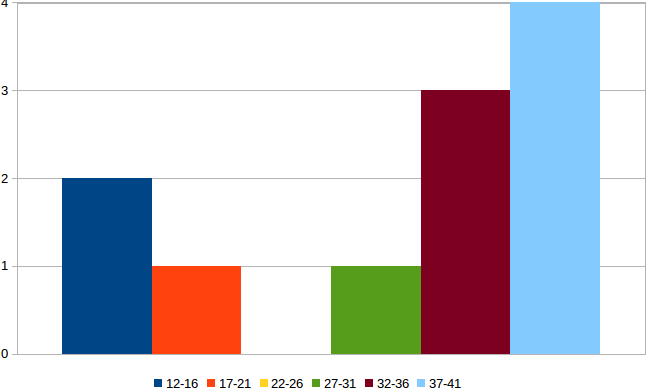
- interval 1: from
12 to16 - interval 2: from
17 to21 - interval 3: from
22 to26 - interval 4: from
27 to31 - interval 5: from
32 to36 - interval 6: from
37 to41
4) Build the frequency table for the intervals 1-6:
- Number of data points within interval 1:
2 - Number of data points within interval 2:
1 - Number of data points within interval 3:
0 - Number of data points within interval 4:
1 - Number of data points within interval 5:
3 - Number of data points within interval 6:
4
5) Get the histogram from the frequency table by using a column chart type. Data values will be represented on the x-axis and the frequencies on the y-axis.