How do you graph #f(x) = x -4#?
2 Answers

The graph of your function is a straight line.
Explanation:
Your function
First you notice that the coefficient of
To plot the graph we can choose two values of
if
if
we can now plot these two points and draw a line through them:
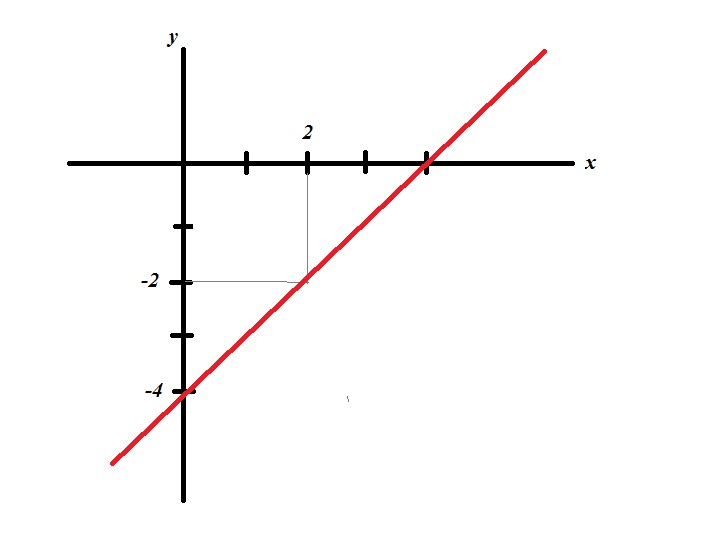

Find the coordinate of the points that intercept the axes. These are (0, -4) and (4, 0). Then trace a line passing through these points.
Explanation:
This is a linear function, its shape is a line and it only takes two points to trace. The two points chosen should be the intercepts of the axes. Therefore, you should solve:
This gives you two dots:
When x=0, y=-4: (0, -4).
When y=0, x=4: (4, 0).
graph{x-4 [-10, 10, -5, 5]}
