#color(blue)("Preamble")#
To build a graph (2 axis style #-> " Cartesian"#) we need to be able identify the values in each axis. We can assign (within limits) any value we wish to #x#. So it does nor matter if this is imbedded within other value/actions. We must have the y value isolated (on its own).
#x# is the independent variable. We can decide the value it takes.
#y# is the dependant variable. Its value 'depends' on the value we assign to #x#.
'~~~~~~~~~~~~~~~~~~~~~~~~~~~~~~~~~~~~~~~~~~~~
#color(blue)("Solving your question")#
Given:#color(green)(" "-x-3y=2)#
To isolate the terms with #y# in them (only 1) add #color(red)(x)# to both sides
#color(green)(" "-xcolor(red)(+x)-3y" "=" "2color(red)(+x))#
#0-3y=2+x#
Multiply both sides by -1 giving
#+3y=-x-2#
Divide both sides by 3
#3/3xxy=-x/3-2/3#
But #3/3 = 1#
#1xxy=-x/3-2/3#
#color(blue)(y=-x/3-2/3)# ...........................(1)
'~~~~~~~~~~~~~~~~~~~~~~~~~~~~~~
You now have a choice. You can leave as is or you can factor out the #1/3#. This option would look like:
#color(brown)(y=1/3(-x-2)# or even ........................(2)
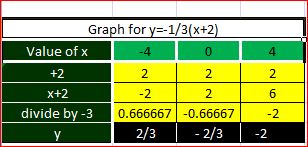
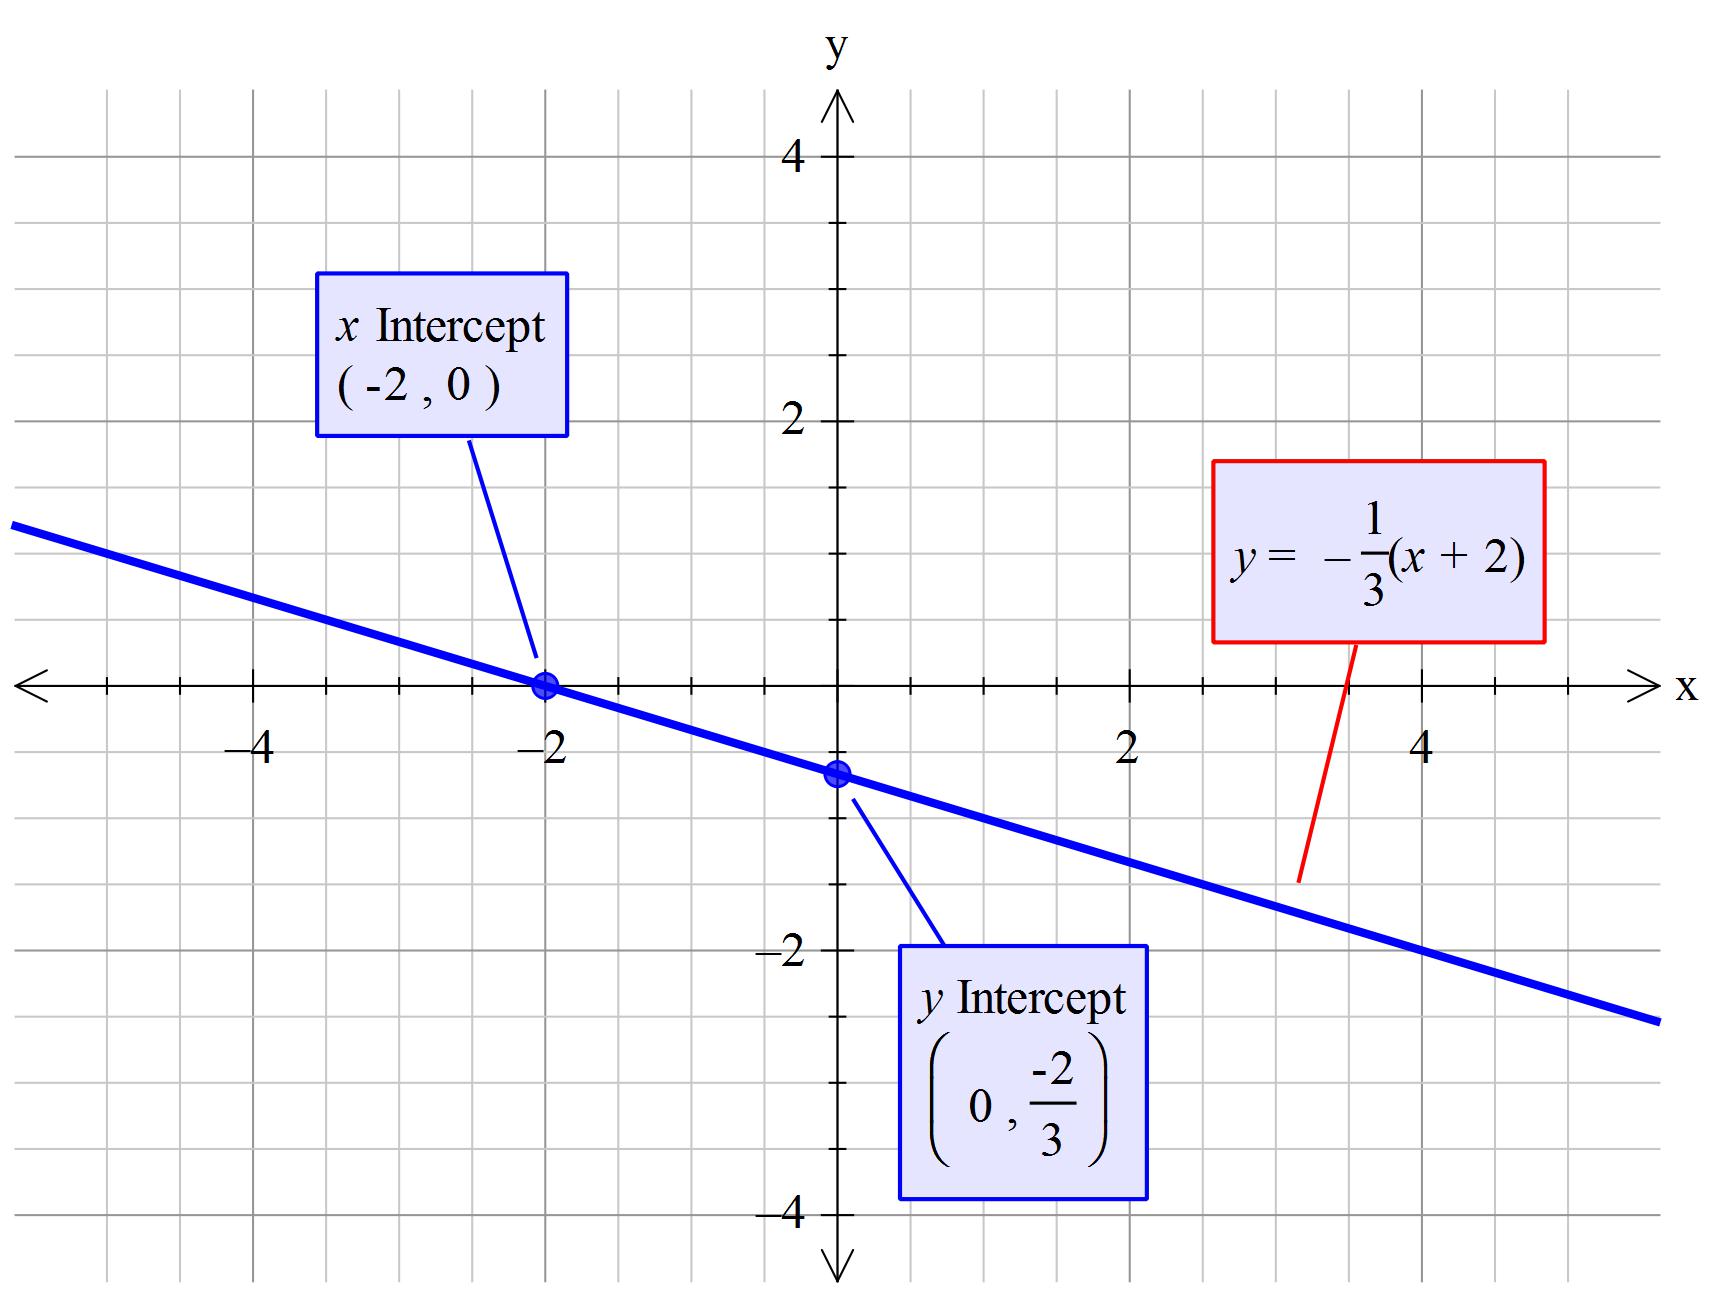
#color(brown)(y=-1/3(x+2)#.........................(3)
#color(magenta)("Equations (1) ,(2) and (3) will all plot the same curve.")#
To draw the graph you can build a table of values and then plot #x# against #y#
The other option is to calculate the value of #x# if #y=0# and the value of #y# if #x=0#