How has ice cover near the North Pole changed in the last few decades?
1 Answer

Ice cover across the North Pole has fluctuated over the past few decades but the general trend is that it is decreasing.
Explanation:
Ice cover across the North Pole has fluctuated over the past few decades but the general trend is that it is decreasing.
The graph below shows the average sea ice extent by month from 1979-2000 in grey and sea ice extent over the past few winters in blues, green, and purples. All of the data for recent years fall below the average for 1979-2000.
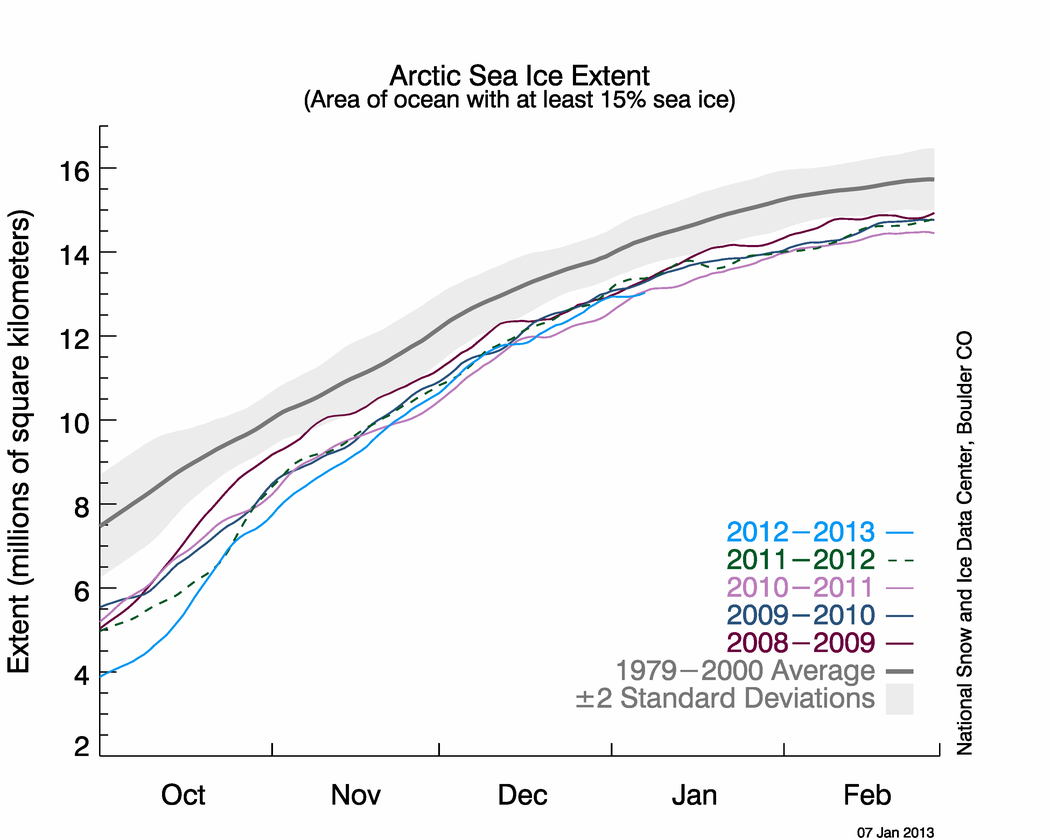
The ice in the Arctic naturally grows in the winter and shrinks in the summer. The maximum coverage occurs between the months of February and March. The maximum extent in 2016 was the lowest since records were first started in 1979 (see here).
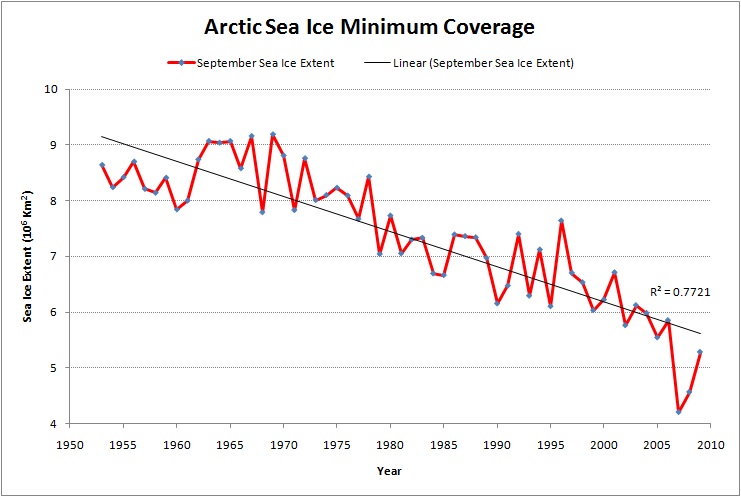
The minimum coverage typically occurs in September. The graph below shows the minimum amount of ice covering the Arctic in September from the 1950s to 2010. As you can see, while there are fluctuations, the general trend is negative, indicating that less and less ice covers the Arctic in September.
You can watch a time-lapse video of ice cover from 1987 to 2014 that shows the declining ice levels in the Arctic, especially older ice, here:
