Assuming that the range of #sin^(-1)x # is #(-oo, oo)#, is # x sin^(-1) x # differentiable, for #sin^(-1)x in [0, 2pi]#?
3 Answers
I'm not sure I've answered your question, but this may help.
Explanation:
For multivalued
#y/x = sin^-1 x#
#sin(y/x) = x#
Implicit differentiation gives:
#cos(y/x)((y'x-y)/x^2) = 1#
#xy'cos(y/x)-ycos(y/x) = x^2#
# y' = (x^2+ycos(y/x))/(xcos(y/x))#
Replacing
#y' = (x+sin^-1xcos(sin^-1x))/cos(sin^-1x)#
I am uncertain about rewriting
It looks to me like the derivative will exist provided that
For what it's worth, here is Socratic's graph of
It's hard to see, but the graph is a sequence of loops getting longer and "more perpendicular". (I just invented that technical description.)
graph{sin(y/x)=x [-1.92, 2.406, -0.684, 1.478]}
See the explanation
Explanation:
What I mean by my assumption that
follows.
If
sin^(-1)y# are one and the same.
And then, for the locally bijective f(x),
Accordingly, it is indubitable that
only when k = 0...
I am aware that some students, at Middle School Level, might find
this difficult to follow. So, I use in my answer the conventional
chosen problem.
Here,
Using the notion of the general value of inverse sine, define
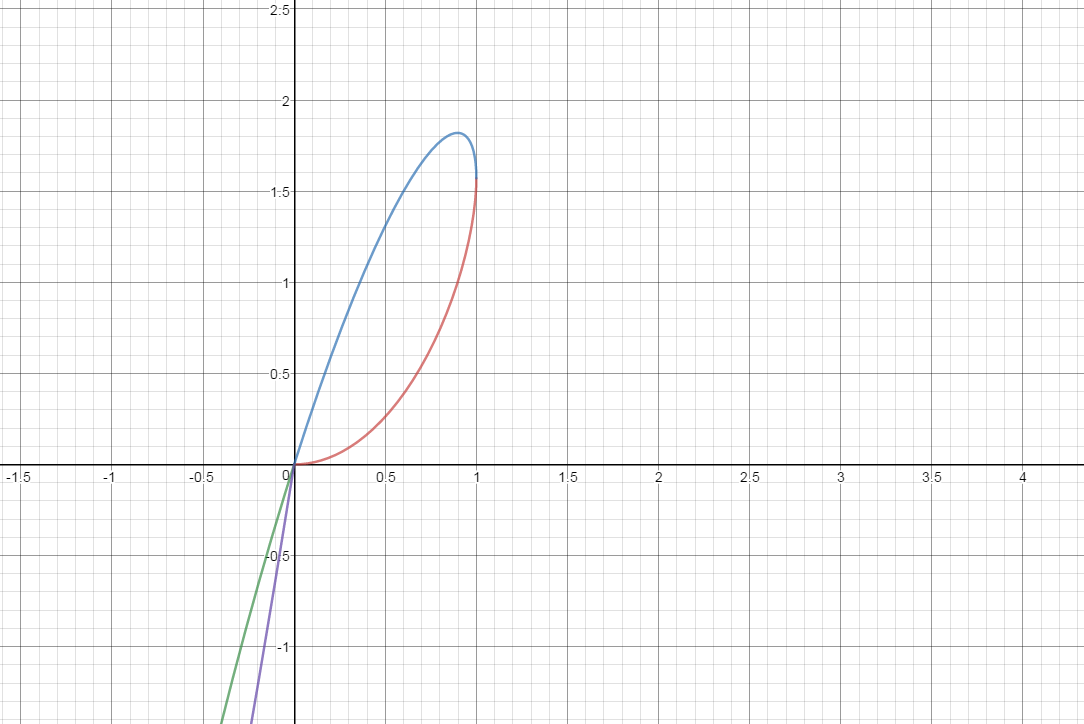
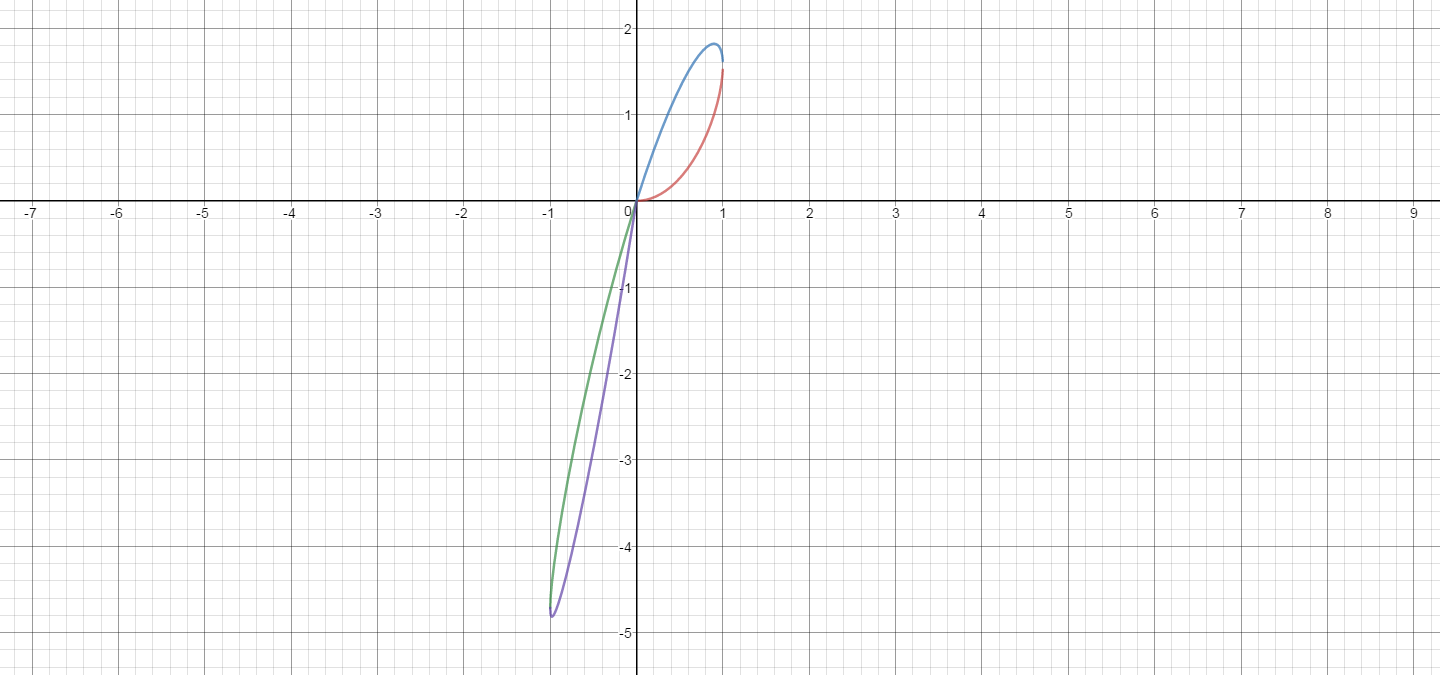
The graph comprises two loops with origin as the common point.
The loops are in between the parallels
Output from
loop is in
to the turning point (0.8970, 1.820) at a higher level, for y'=0. .
The second loop is in
For my piecewise definition of y, y is continuous and differentiable
everywhere, including the points at which two neighboring pieces
meet.
It will be a graph in grandeur, with loops getting elongated, in
infinitude, in between
with amplitude increasing without limit...
I welcome a graph for the data given below, for just two loops.
(x, y): (0, 0) (.2, .0427) (.4, .6146) (.6, .3861) (.8, .7418) (1, 1.571) (8, 1.771)
(.6, 1.499) (.4, 1.092) (.2, 0.580) (0, 0) (-.2, 0.6686) (-.4, -1.421) (-.6, -2.271) ( -.8, -3.255) (-1, -4.712) (-.8, -4.285 (-.6, -3.384) (-.4, -2.349), (-.2, -1.216) (0, 0)
I can't get the Socratic graphing utility on one graph, but here are the two loops.
Explanation:
In the first graph,
In the second graph,
graph{(y-xarcsin(x))(sqrt(x-x^2)/sqrt(x-x^2))(y-x(pi-arcsinx))=0 [-3.385, 4.414, -0.96, 2.937]}
graph{(y-x(pi-arcsinx))(y-x(2*pi + arcsinx))sqrt(x^2-x)/sqrt(x^2-x)=0 [-4.273, 6.83, -5.08, 0.47]}
Using the Desmos graphing website, I got this graph using


Unfortunately these will not zoom or scroll here.
I built them at https://www.desmos.com/calculator

