How do you graph the equation #y-8=-x# by making a table and what is its domain and range?
1 Answer

Read explanation
Explanation:
there are many ways to go about it, i am going to show you how graph this equation and how to find domain and range.
First step: we need to solve for
add 8 both sides of equation
simplify both sides of equation
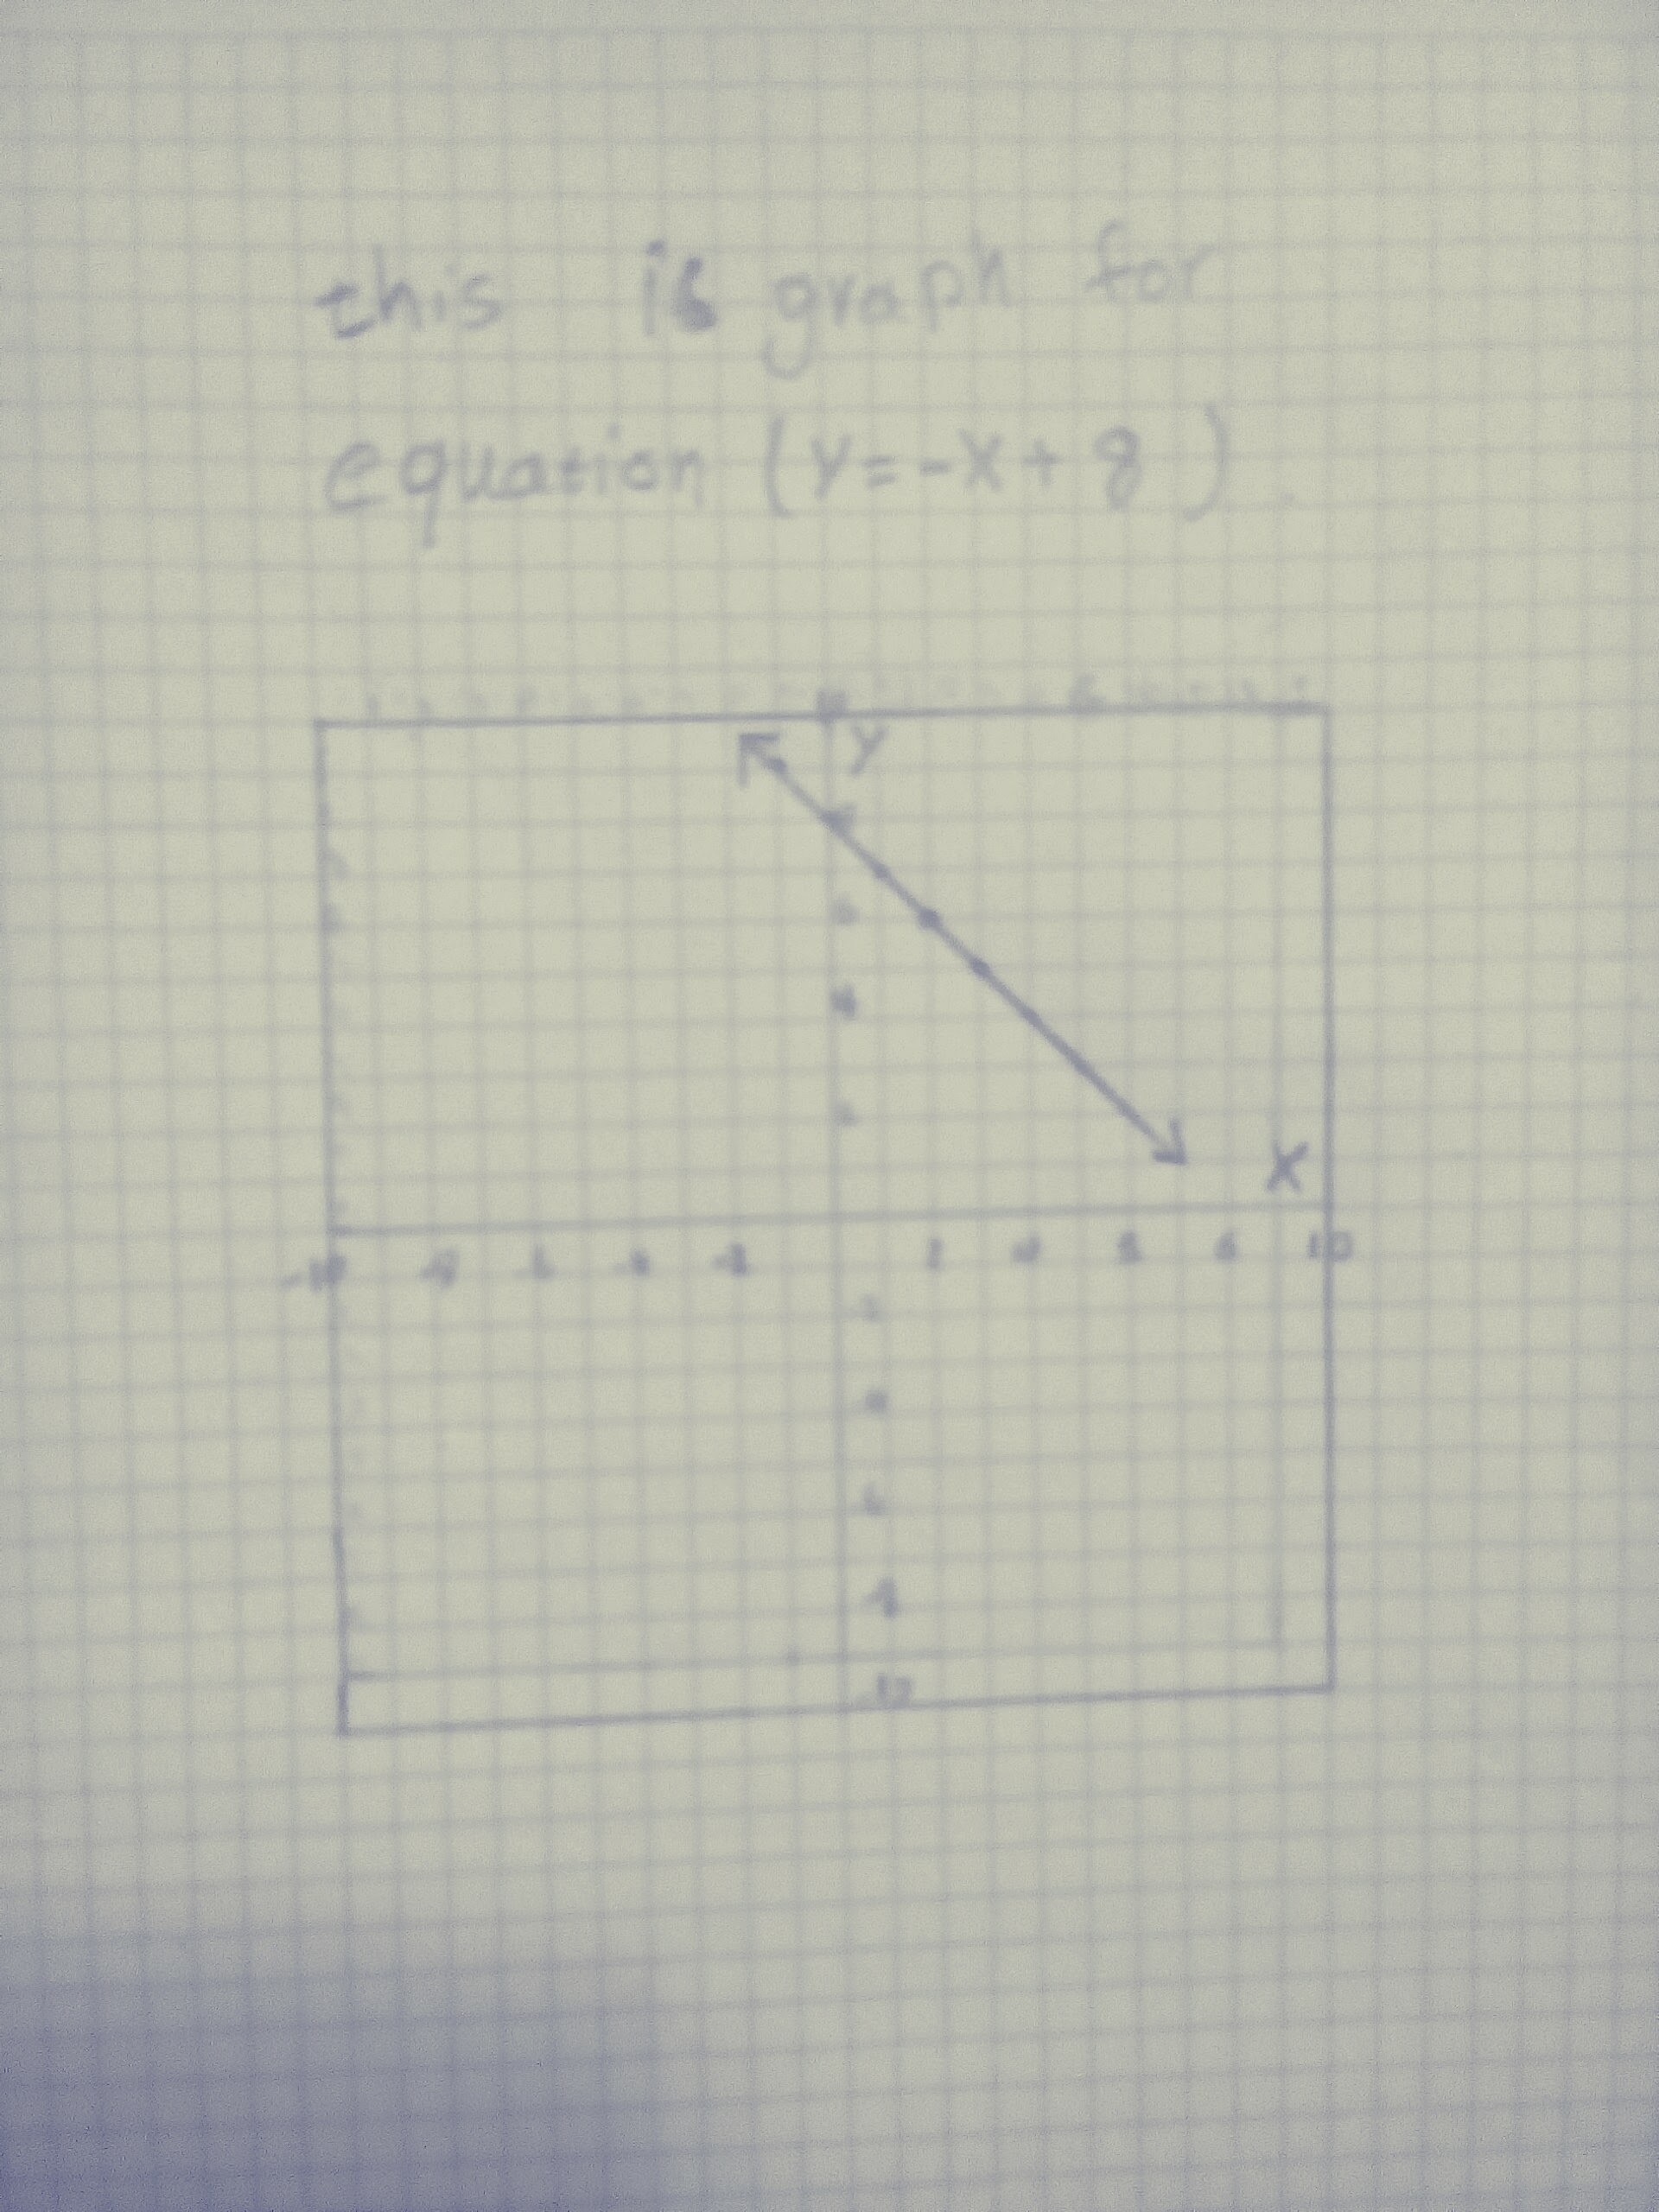
Second step: graph the equation by making a table
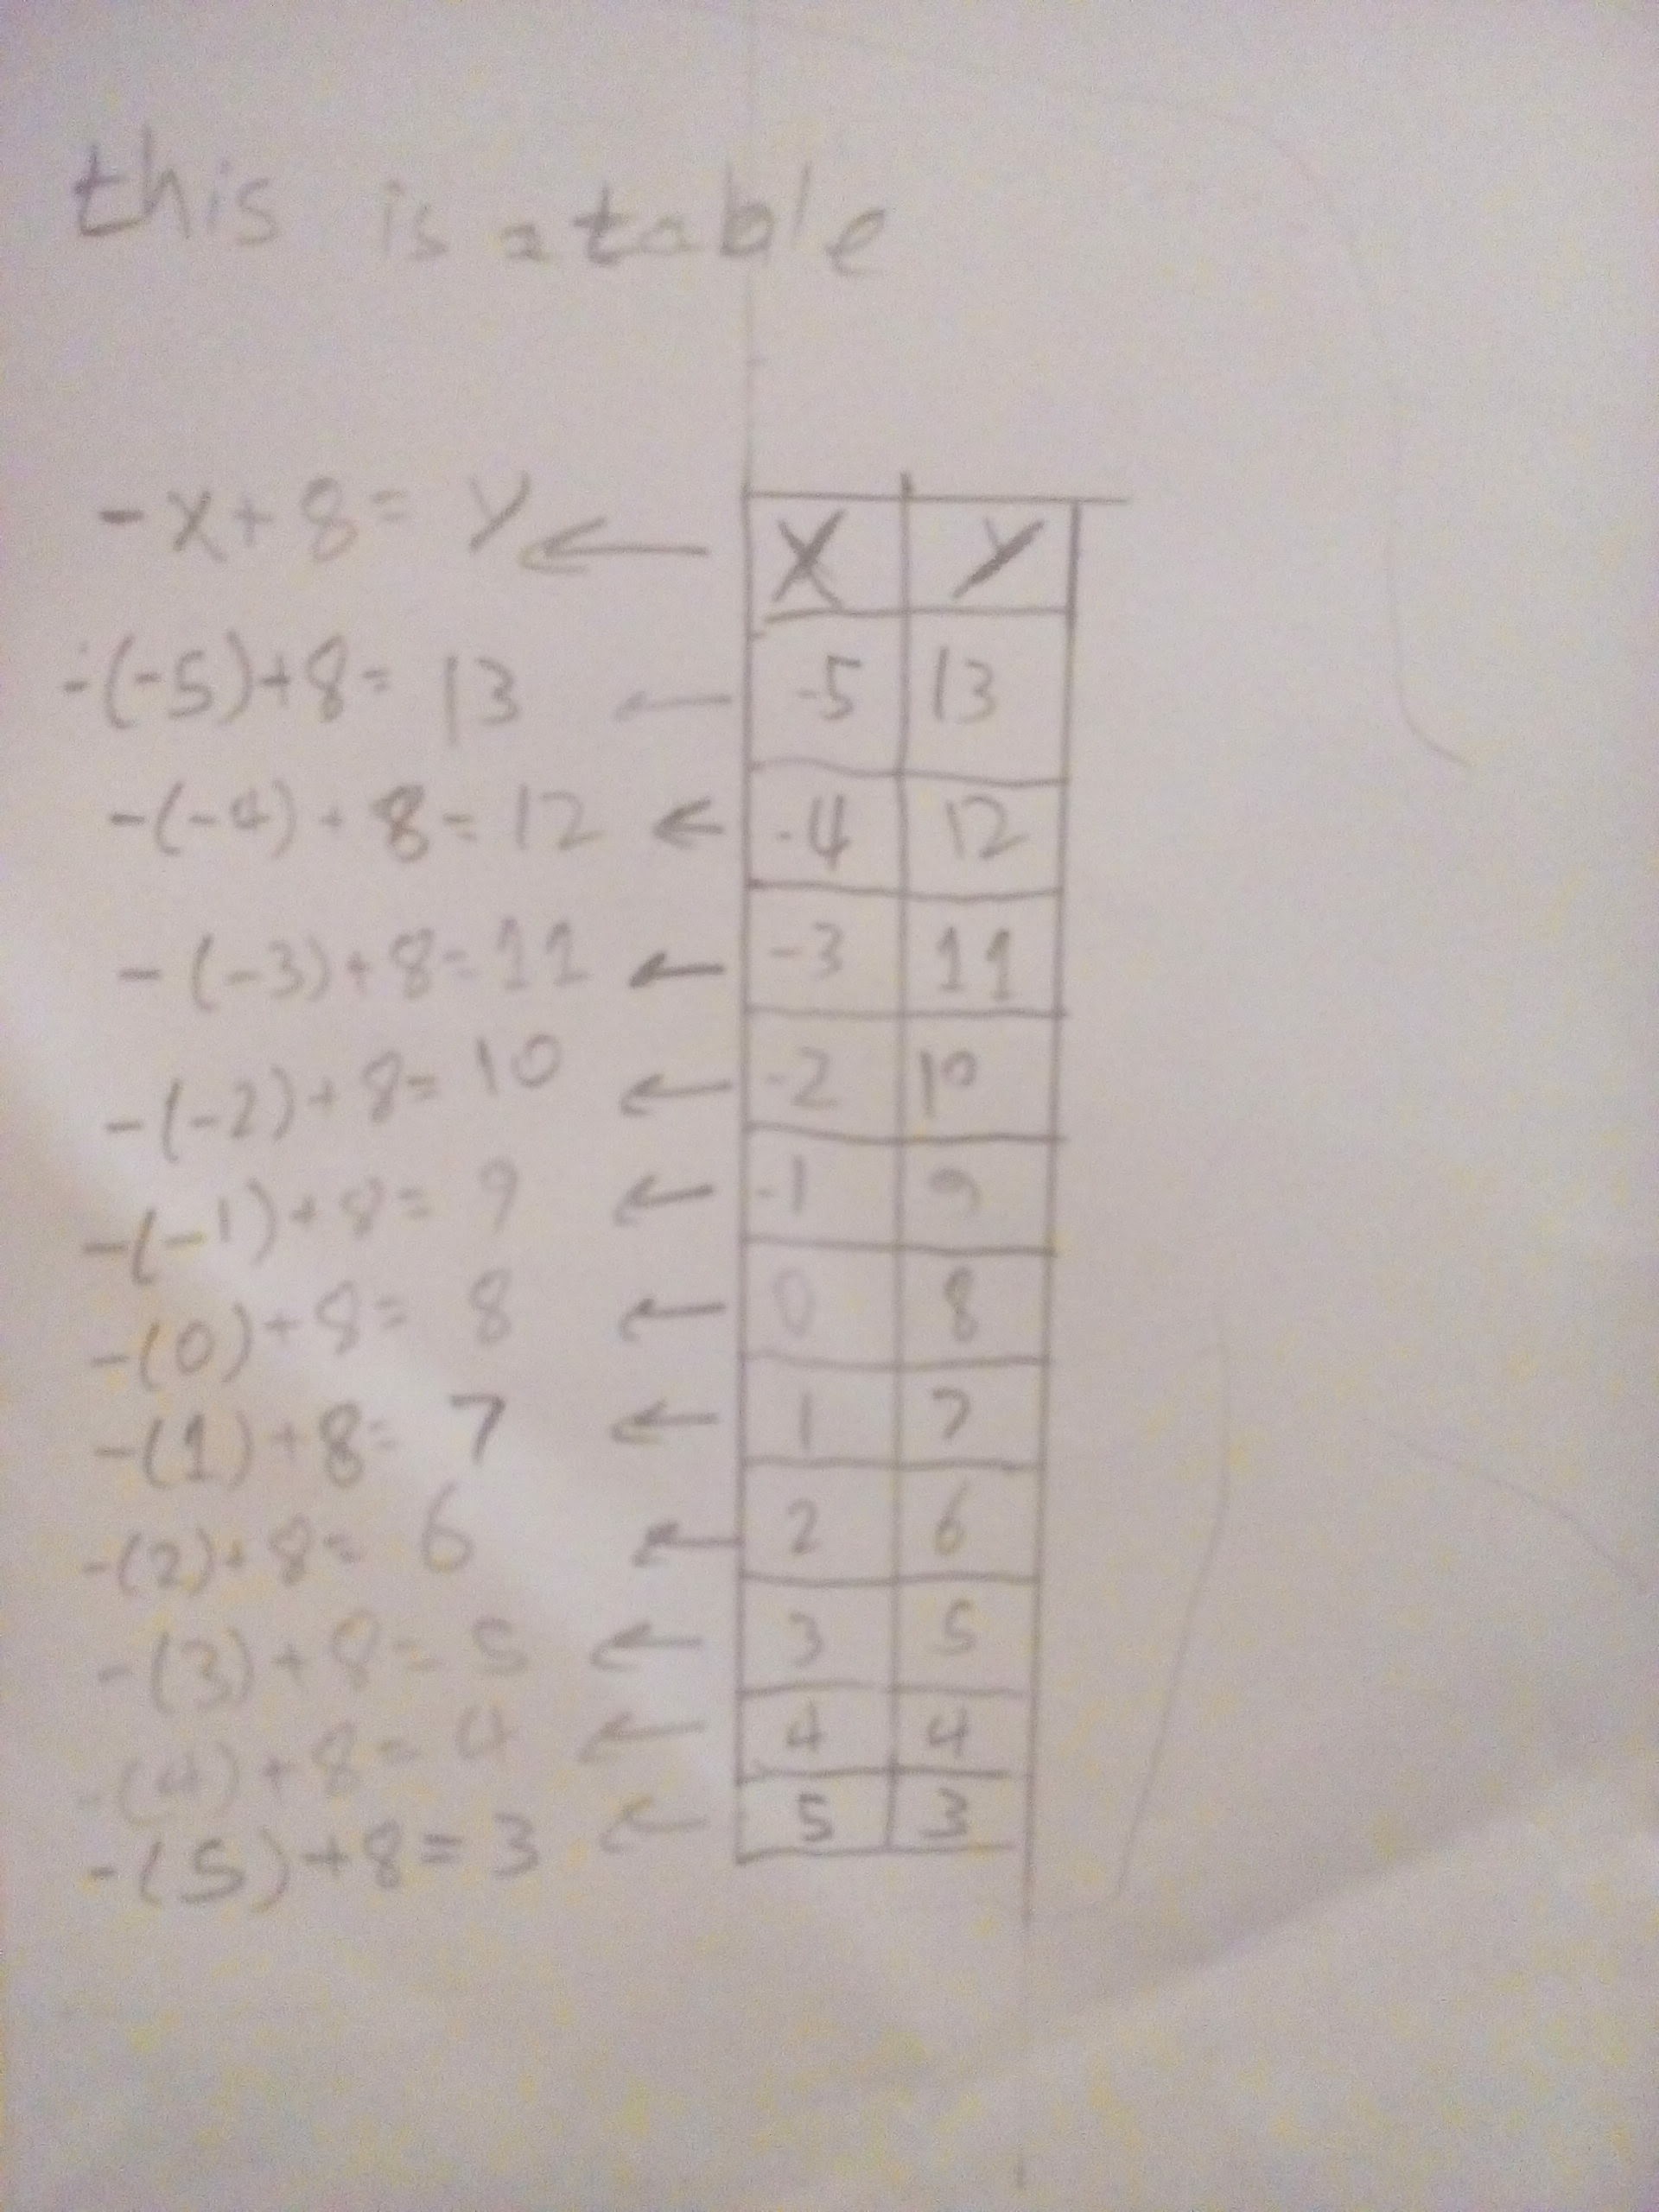
and then choose two points at least from the table and then put these points graph and then match the points by one line
Third step: find domain and range
Consider a simple linear equation like the graph shown, below drawn from the function
or we can say domain and range equal all real number
Domain and Range = (
