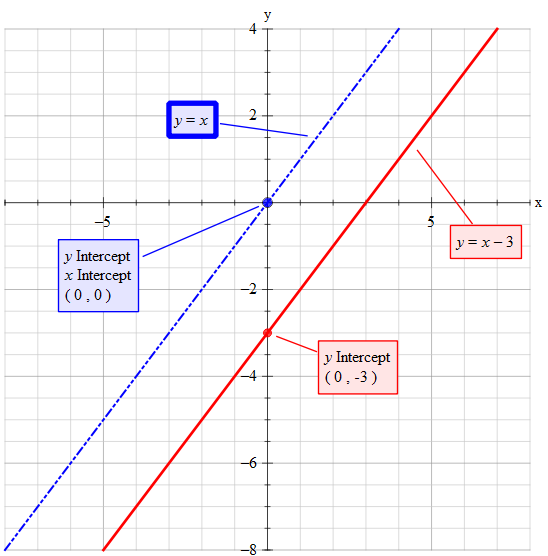
The graph of #y=x-3# is almost the same as #y=x#. The difference is that every point on #y=x# has been lowered by 3.
Thus, instead of the y-intercept being at #y=0# it is at #y=-3# instead.
Consider the generic equation of #y=mx+c color(white)(.)# where #m# is the gradient (slope).
If you compare this to both #y=x# and #y=x-3# you will observe that there is no value shown for #m#. That is because it is there but it's value is 1 and it is good mathematical practice to NOT write #1x#
The gradient of 1 #=("count of up or down")/("count of along - left to right")#
This must mean that the (count of up or down) = (the count of along")
The y-axis passes through the x-axis at #x=0# so if we substitute the value of 0 for #x# we get:
#y=x-3" "->" "y=0-3#
So at #x=0# we have #y=-3#
So the x-intercept is at the point #P->(x,y)=(0,-3)#
Similarly the graph crosses the x-axis at #y=0# so by substitution we have:
#y=x-3" "->" "0=x-3#
Add 3 to both sides
#0+3=x-3+3#
#3=x+0#
#x=3#
So the y-intercept is at the point #P->(x,y)=(3,0)#

