What is a Phase diagram?
1 Answer

A phase diagram is a graph that shows the relation between pressure and temperature and the resulting phases that exist for a substance.
Explanation:
A phase diagram is a type of graph in which one plots pressure as a function of temperature for a substance (such as water or
The curves that appear on the graph separate conditions that would result in formation of a gas from those that result in liquid or solid. As a result, we can also show all possible situations in which gas and liquid or liquid and solid, etc. are in equilibrium.
The phase diagram for water appears below:
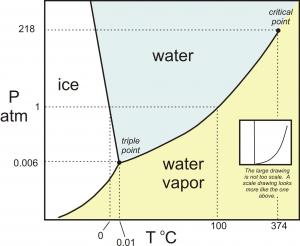
Any combination of pressure and temperature that corresponds to a point in the blue shaded are would result in
Points on a curve are those conditions for which two phases could coexist (over the long term) and both would be stable, such as ice floating in water, but not melting. Also shown is the unique triple point where all three phases can coexist.
This means that if conditions change such that we move from the one area into another, a phase change must occur. A vertical line describes a change in pressure, while a horizontal line would be a change in temperature.
Thus we can explore situations that would involve increasing pressure to melt ice (a very unusual occurrence), or lowering pressure on liquid water to cause it to boil (a favourite classroom demonstration).
