Build a table of values relating #y# to #x#. You must take into account that what we really have is #y=+-sqrt(2x+3)#. Plot the points and draw the best line you can through those points.
Note that the x-intercept is where #y=0=sqrt(2x+3)#
Also note that #sqrt(0)=0" "=>" "2x+3=0#
#2x=-3#
#x_("intercept")=-3/2#
~~~~~~~~~~~~~~~~~~~~~~~~~~~~~~~~~~~~~~~~~~~~~~
Lets suppose you do not have a calculator. Then you need to select values for #2x+3# that are known squared values and adjust #x# to give them.
This is the selection:
#(+-1)^2=1#
#(+-2)^2=4#
#(+-3)^2=9#
#(+-4)^2=16#
#(+-5)^2=25 larr# stop at this one as they are getting a bit big
#color(blue)("Set "2x+3=1" " =>" " 2x=-2" " =>" "x=-1)#
#" "+-y=+-1=+-sqrt(2(-1)+3) #
#" "color(brown)(=> (x,y) = (-1,+1)" " &" " (-1,-1))#
................................................................................................
#color(blue)("Set "2x+3=4" " =>" " 2x=+1" " =>" "x=+1/2)#
#" "+-y=+-2=+-sqrt(2(1/2)+3) #
#" "color(brown)(=> (x,y) = (1/2,+2)" " &" " (1/2,-2))#
................................................................................................
#color(blue)("Set "2x+3=9" " =>" " 2x=+6" " =>" "x=+6/2#
#" "+-y=+-3=+-sqrt(2(6/2)+3) #
#" "color(brown)(=> (x,y) = (6/2,+3)" " &" " (6/2,-3))#
................................................................................................
#color(blue)("Set "2x+3=16" " =>" " 2x=+13" " =>" "x=+13/2#
#" "+-y=+-4=+-sqrt(2(13/2)+3) #
#" "color(brown)(=> (x,y) = (13/2,+4)" " &" " (13/2,-4))#
................................................................................................
#color(blue)("Set "2x+3=25" " =>" " 2x=+22" " =>" "x=+22/2#
#" "+-y=+-5=+-sqrt(2(22/2)+3) #
#" "color(brown)(=> (x,y) = (22/2,+5)" " &" " (22/2,-5))#
~~~~~~~~~~~~~~~~~~~~~~~~~~~~~~~~~~~~~~~~~
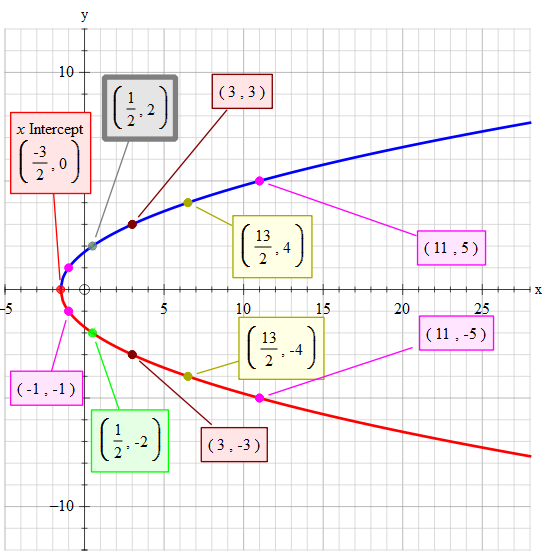
Your graph should look like this: