Method 1: Split the absolute value possibilities
#{:
("possibility: "(k-5) < 0 (rarr k < 5),color(white)("X")"or"color(white)("X"),"possibility: "(k-5)>=0 (rarr k>=5)),
("then " abs(k-5)<=4,,"then " abs(k-5) <=4),
(rarr 5-k <=4,,rarrk-5 <-4),
(color(white)("XX")1 <= k,,color(white)("XX")k <=9),
(k < 5" and "k>=1,color(white)("X")" or "color(white)("X"),k>=5" and "k<=9)
:}#
Combining the two possibilities we have
#color(white)("XXX")1 <= k <=9#
~~~~~~~~~~~~~~~~~~~~~~~~~~~~~~~~~~~~~~~~~~~~~~~~~~~
Method 2: square the two sides then check critical and sample interval points
Given #abs(k-5) <= 4#
Squaring both sides:
#color(white)("XXX")k^2-1ok+25 <= 16#
#color(white)("XXX")k-10k+9 <=0#
#color(white)("XXX")(k-1)(k-9) <= 0#
Giving the critical points #color(red)(k=1)# and #color(red)(k=9)#
We can then select arbitrary interval points:
for #k < 1#, #color(white)("XX")#I selected #color(blue)(k=0)#
for #k in (1,9)#, I selected #color(blue)(k=5)#
for #k > 9#, #color(white)("XX")#I selected #color(blue)(k=10)#
#{:
(," | ",color(blue)(k=0),color(red)(k=1),color(blue)(k=5),color(red)(k=9),color(blue)(k=10)),
(abs(k-5)," | ",5,4,0,4,5),
("? ? "<=4," | ",F,T,T,T,F)
:}#
So the inequality is true for #k=1#, points between #k=1# and #k=9#, and for #k=9#
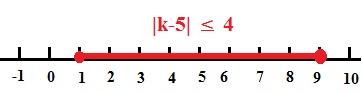
That is the inequality is valid for #k in [1,9]#
~~~~~~~~~~~~~~~~~~~~~~~~~~~~~~~~~~~~~~~~~~~~~~~~~~~~~
Plotting is simply a matter of drawing this result on the number line.