Know that the parent function is #y=x^2#. This is where we start and so our starting function looks like this:
#y=x^2# graph{x^2 [-10.04, 9.96, -1, 9]}
Looking at just #y=(x-3)^2# the fact that the #-3# is on the #color(red)("inside")# of the #()# it tells us that the function is shifted or translated #3# units to the #color(red)("right")#.
Thus far, our function looks like this:
#y=(x-3)^2# graph{(x-3)^2 [-5.45, 14.55, -1, 9]}
Lastly, looking at the entire function #y=(x-3)^2+1#, the #1# tells us to shift or translate the function #1# unit #color(red)("upward")#.
Our final function will then look like this:
#y=(x-3)^2+1# graph{(x-3)^2+1 [-5.41, 14.59, -0.64, 9.36]}
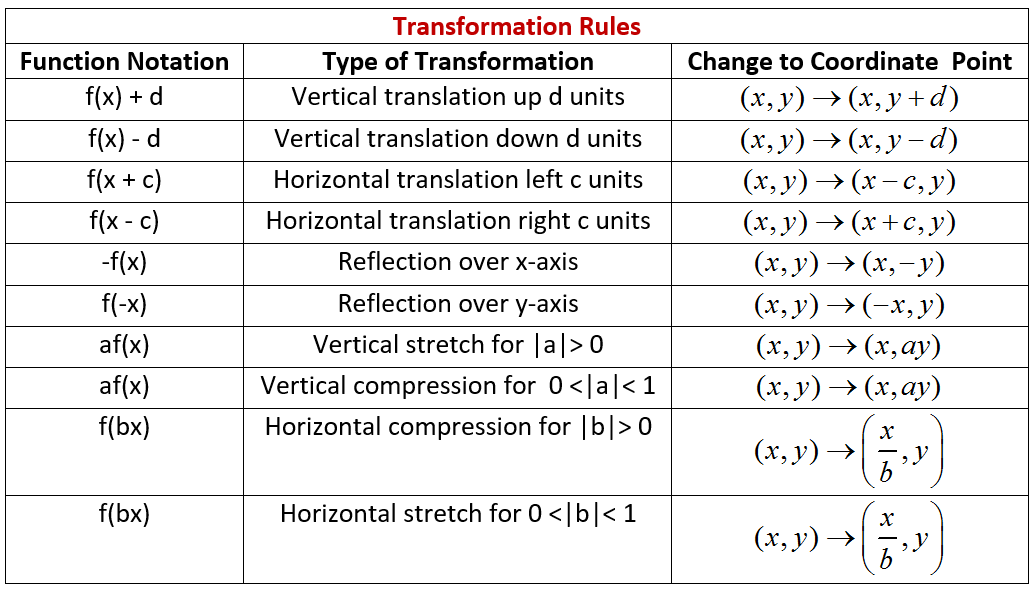
In essence the questions asks you to apply certain transformation rules. I provided a chart of the transformations you should be aware of.