How do you graph the function #y=-2x-3#?

1 Answer
May 25, 2017

See solution below.

Explanation:

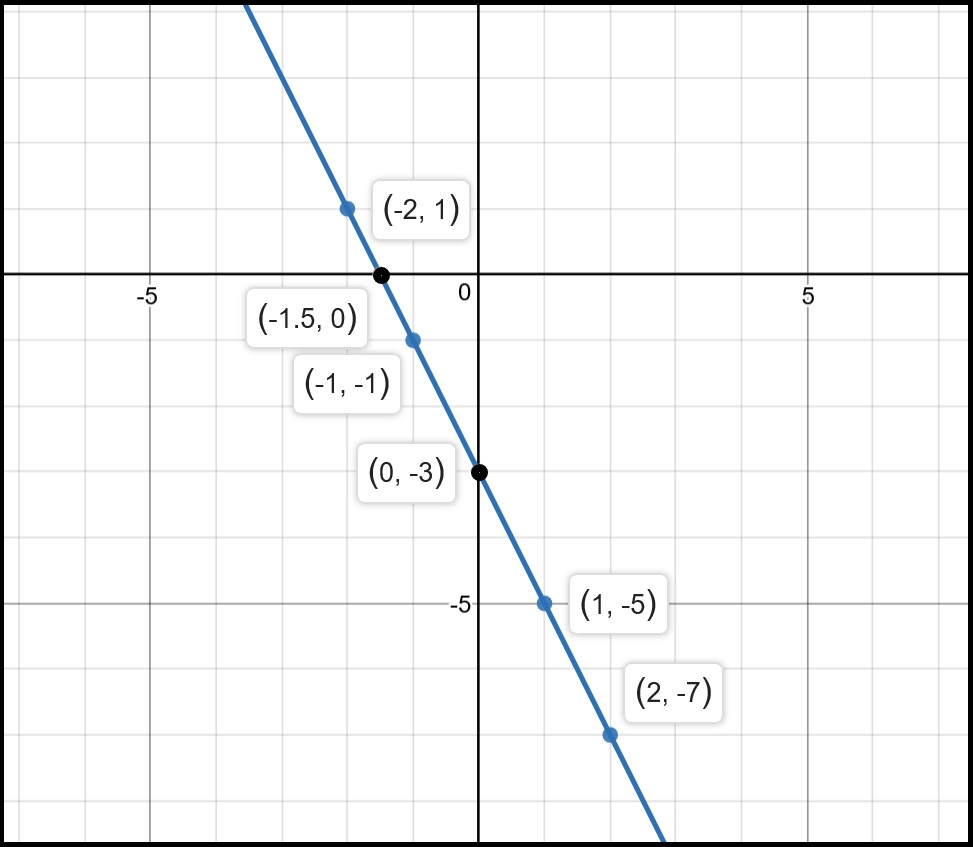
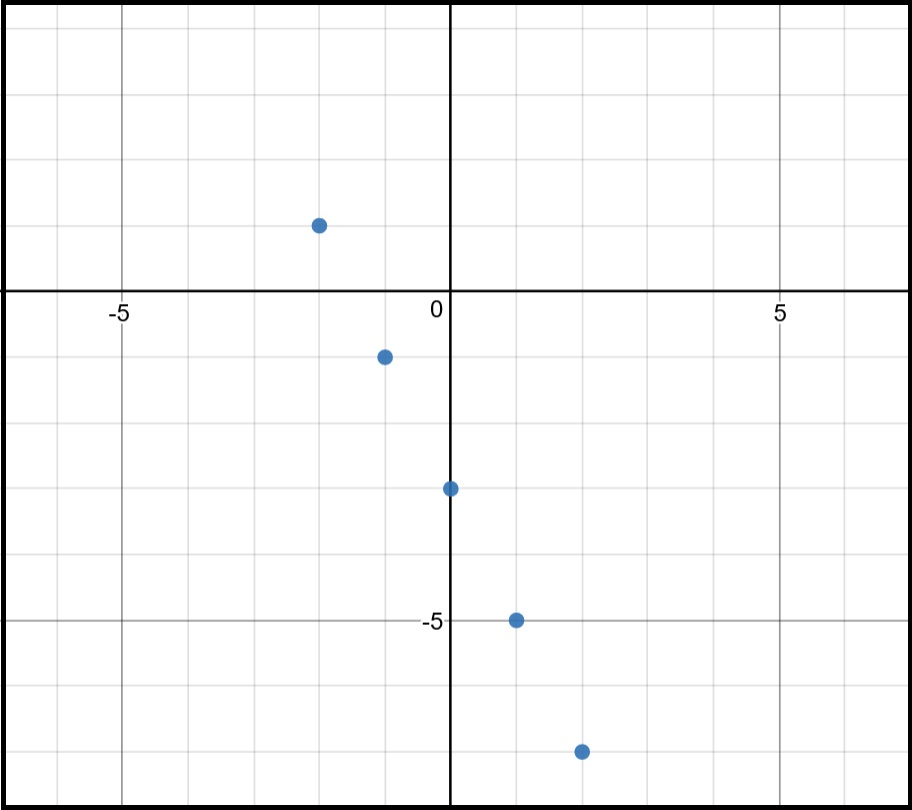
It's important to plot a couple of points first. That is, select reasonable #x# values for inputs and calculate the corresponding #y# values. Putting them in a table like this makes it easier to draw the graph.

Desmos.com and MS Paint

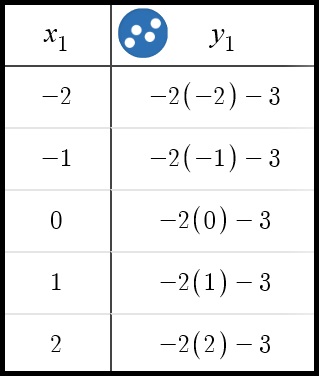
Next, plug these points #x#-values (moving left or right along the horizontal axis) and #y#-values (moving up or down along the vertical axis). Here is what you get.

Desmos.com and MS Paint

Finally, connect the dots to see the graph.

Desmos.com and MS Paint