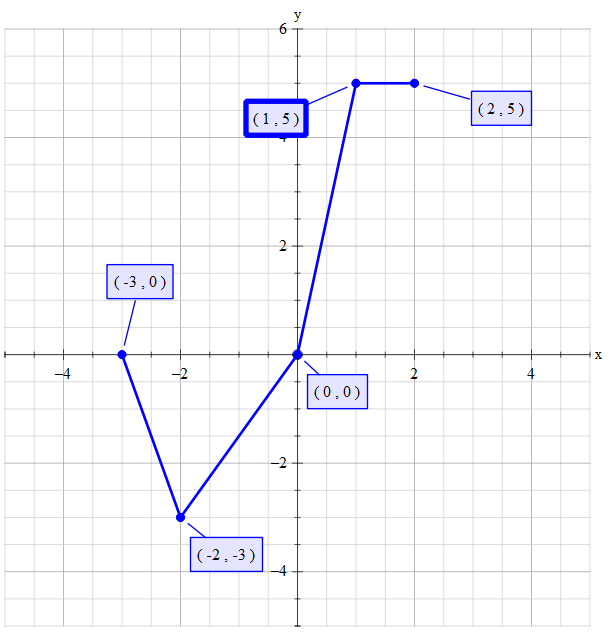
Consider the points (-3,0), (-2,-3), (0,0), (1,5), and (2,5). map the input and the output values in a diagram. does the diagram represent a function? explain
1 Answer

May 26, 2017
I would suggest that the answer is yes
Explanation:
Given that the independent variable is
Connecting the points imply that a cubic equation could be derived that fits this plot.
