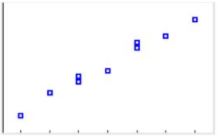
What would be a good estimation of the correlation coefficient for the data displayed in the scatterplot?
A. r = - 0.88
B. r = 0
C. r = 0.65
D. r = 0.98
A. r = - 0.88
B. r = 0
C. r = 0.65
D. r = 0.98
1 Answer

Jun 25, 2017
D
Explanation:
The correlation is positive, therefore it is not A, as A shows negative correlation.
It is not B, as B shows no correlation but this has a correlation.
It is not C, as C shows a weak positive correlation, but the graph shows a strong positive correlation.
It is D as the graph shows:
- Positive correlation
- Strong correlation
- Clear correlation in the first place
