How do you draw f(x) = -2x^2 and g(x) = 2x-4 on the same graphs?
1 Answer
 graphsketch.com
Explanation:
To draw these on the same graph, you first need to know what each graph looks like individually:
graph{-2x^2 [-20, 20, -10, 10]}
Due to the
x-intercept (when y=0),
y-intercept (when x=0),
graph{2x-4 [-40, 40, -20, 20]}
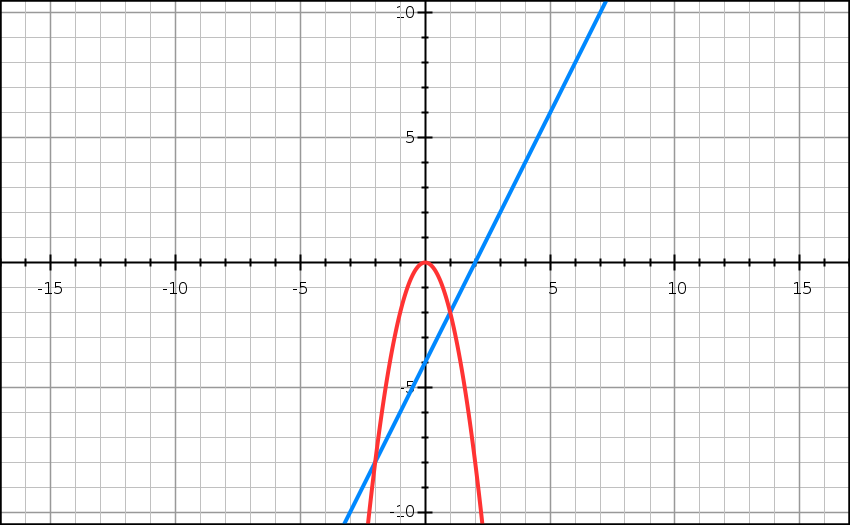
To graph these on the same graph, you need to make sure you have a common scale. These two equations graphed on the same axes look like this:
graphsketch.com
