Question #1916c
1 Answer

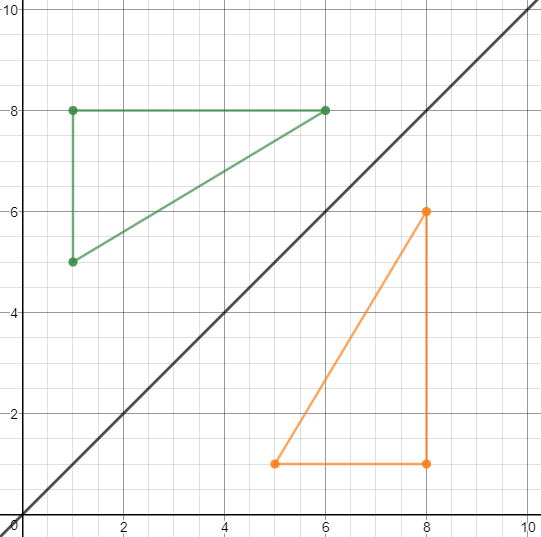
Replace each x-value with the respective y-value, and vice-versa.
Or, reflect over the line x=y, black in the image shown.
Explanation:
In your case, there are only a couple steps to getting the final image.
-
Find and write out all your given points in a table, like this:
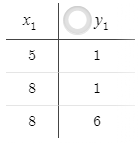
You can get these numbers by looking at the bottom of the graph and finding the x value for a single point, and the corresponding y-value on the vertical axis. -
Now that you have all your points in an (x, y) form, remember your transformation rule: (x, y)
#-># (y, x) -
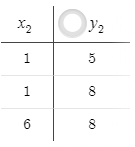
Looking at this, know that you should create a second table, with the new x values being the old y-values, and the new y-values being the old x-values, essentially swapping them:
-
Finally, plot your new points and maybe even connect the lines. This whole process is the same as reflecting over the line y=x.
